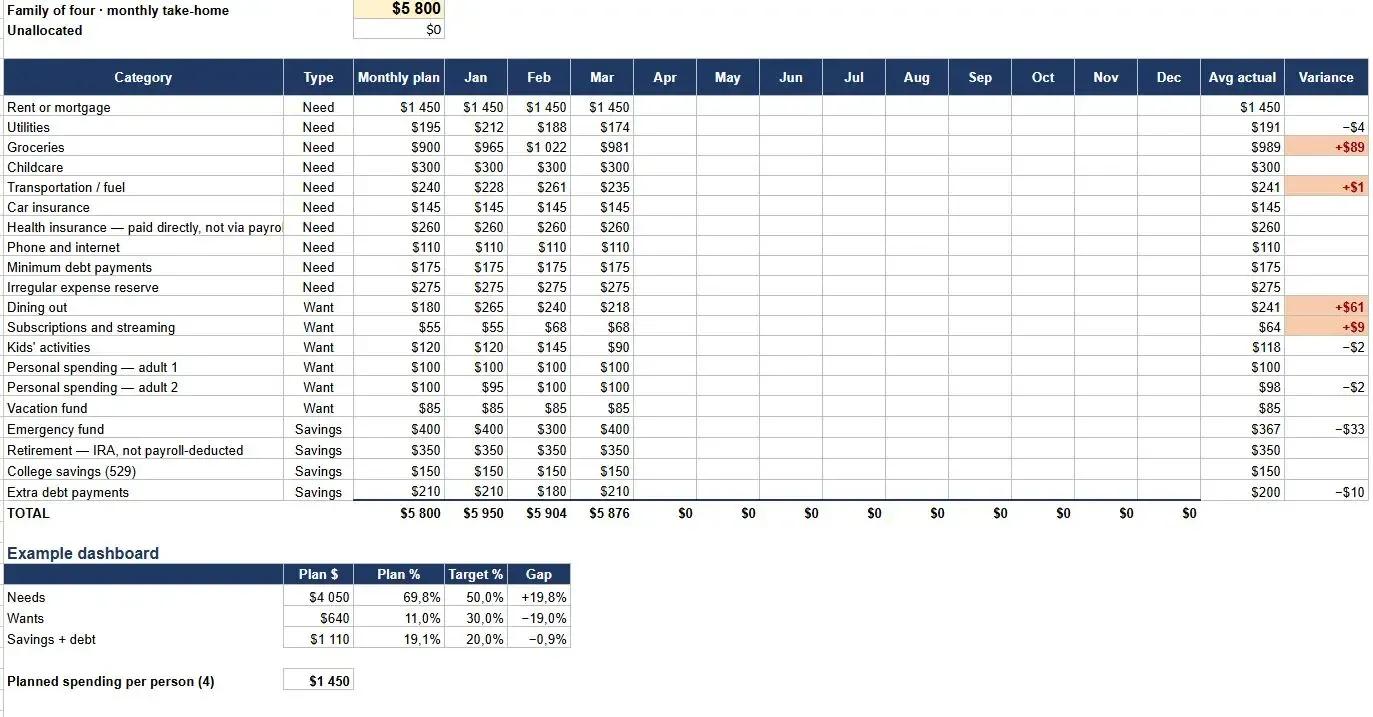


How to Allocate Budget Categories for a Family Making $40,000–$60,000 a Year

Understanding Your Take-Home Pay at $40K–$60K Income
Gross vs. Net Income: What You Actually Bring Home
Your gross salary and your actual spending power are two different numbers – and the gap between them surprises most families. Before allocating a single dollar, you need to know what actually lands in your bank account.
For a single-earner household in 2026, four mandatory deductions hit every paycheck before you see it:
- FICA (Social Security + Medicare): 7.65% flat on all earned income
- Federal income tax: Effective rate of roughly 9–12% after the $14,600 standard deduction, based on IRS SOI Bulletin data (December 2025)
- State income tax: Zero in Texas or Florida; up to 5–6% in California or New York
- Employer-sponsored health insurance: Typically $2,500–$4,500 per year pulled from your paycheck
The Tax Foundation's 2026 report Taxes and the American Household puts the total effective tax rate (federal, state, and local combined) for households earning up to $58,000 at 18.2%. That's the realistic baseline for planning.
According to SmartAsset's Federal Income Tax Calculator: "Based on these rates, this hypothetical $50,000 earner owes $5,914, which is an effective tax rate of about 11.8%."
One important note: families with children often pay significantly less. The Child Tax Credit (up to $2,000 per child) and Earned Income Tax Credit (up to $6,000+ for families with three or more children) can reduce your federal tax bill to near zero – or generate a refund. If you haven't run your numbers through the IRS EITC Assistant, do that before finalizing any budget.
According to the Pew Research Center analysis from February 2026, the expiration of TCJA provisions starting in 2026 may push the federal tax burden for this income group up by 2–3 percentage points – another reason to lock in your current-year estimates rather than relying on older calculators.
Monthly Take-Home Pay Estimates by Income Level
Here's what a single-earner family realistically takes home each month in a moderate-tax state (no state income tax assumed), before employer health insurance:
| Gross Annual Income | Monthly Gross | Est. Federal Tax + FICA | Monthly Net (approx.) |
|---|---|---|---|
| $40,000 | $3,333 | ~$650–$720 | $2,600–$2,700 |
| $45,000 | $3,750 | ~$730–$820 | $2,900–$3,000 |
| $50,000 | $4,167 | ~$820–$930 | $3,200–$3,300 |
| $55,000 | $4,583 | ~$920–$1,050 | $3,500–$3,600 |
| $60,000 | $5,000 | ~$1,040–$1,180 | $3,800–$3,900 |
Estimates based on 2026 federal tax brackets, $14,600 standard deduction, FICA 7.65%. Add state income tax (0–6%) and health insurance ($200–$375/month) to get your personal figure. Use Calculator.net's Take-Home Pay Calculator to run your exact scenario.
The Federal Reserve's FRED database shows real median household income in the United States reached $83,730 in 2024, per FRED Series MEHOINUSA672N. A family earning $40K–$60K sits at roughly 48–72% of that benchmark – lower-middle income by national standards, but workable with disciplined category allocation.
Recommended Budget Category Breakdown (Percentage Guide)
The 50/30/20 Rule Applied to $40K–$60K Families
The 50/30/20 rule – 50% to needs, 30% to wants, 20% to savings and debt – is the most widely cited budgeting framework in the U.S. For families in the $40K–$60K range, it works as a diagnostic tool more than a rigid prescription.
The problem is math. BLS Consumer Expenditure Survey data consistently shows that housing alone runs 33–35% of average household spending. Add food (12–15%) and transportation (15–18%), and you're already at 60–68% – before healthcare, childcare, or a single debt payment.
As The Balance noted in its 2025 personal finance guide: "The 50/30/20 rule today works not as a rigid law but as a diagnostic tool. If your needs are 65% of income, that's not a budgeting failure – it's a signal to revisit your largest expense categories, such as housing or transportation costs."
For most families in this income bracket, a modified 60/20/20 framework is more realistic:
- 60% → Needs (housing, food, transportation, healthcare, utilities, minimum debt payments)
- 20% → Savings and debt payoff (emergency fund, retirement, extra debt payments)
- 20% → Wants (dining out, entertainment, subscriptions, hobbies)
If childcare is in the picture, the needs bucket often stretches to 70–75%, which means the wants category absorbs the pressure – not savings. NerdWallet flagged this dynamic in 2024, advising families to compress wants to 15–20% rather than sacrifice the 20% savings floor.
Full Category Breakdown with Percentages and Dollar Amounts
Applying the 50/30/20 framework to three realistic net-income tiers:
| Net Monthly Income | Needs (50%) | Wants (30%) | Savings + Debt (20%) |
|---|---|---|---|
| $3,000/month | $1,500 | $900 | $600 |
| $3,400/month | $1,700 | $1,020 | $680 |
| $3,900/month | $1,950 | $1,170 | $780 |
These numbers assume no childcare. Add $500–$1,000/month for one child in center-based care and the needs column immediately overwhelms the 50% ceiling – which is exactly why the modified 60/20/20 split exists.
Essential Budget Categories for Middle-Income Families
Housing (Rent or Mortgage) – Target: 25–30%
The 30% rule for housing comes from HUD, and it marks the clearest line in family budgeting: spend more than 30% of gross income on rent or mortgage, and you're officially "cost-burdened."
At $40K/year, that ceiling is $1,000/month. At $60K, it's $1,500/month. In high-cost metros – New York, San Francisco, Seattle – those numbers don't get you much. In Memphis, Tulsa, or Albuquerque, they cover a solid two-bedroom apartment.
If you're over 30%, the first moves to consider:
- House hacking: Renting a spare bedroom for $500–$800/month brings a $1,400 rent payment down to an effective $500–$800 – well inside the threshold even at $40K income
- Geographic arbitrage: Moving 20–30 miles outside a major metro often cuts rent by 25–40%
- Housing assistance programs: Section 8 vouchers and local housing authority programs remain underutilized by families just above the poverty line – check eligibility even if you think you won't qualify
In our experience reviewing household budgets across the $35K–$75K range, housing is the single category where a one-time decision – where you live – determines whether the rest of the budget works at all.
Food & Groceries – Target: 10–15%
USDA Food Plan data puts average grocery spending at roughly $363 per person per month. For a family of four, that's $1,300–$1,500/month on a moderate plan – 43–50% of net income at $40K. That's not sustainable.
The USDA Thrifty Food Plan targets around $850–$950/month for a family of four with careful meal planning. The gap between these two numbers – roughly $400–$500/month – closes through:
- Weekly meal planning before grocery shopping
- Buying proteins and staples in bulk (warehouse stores pay off at this family size)
- Reducing food waste, which the USDA estimates costs American households $1,500+ per year
If your household qualifies for SNAP benefits (income eligibility for a family of four extends to roughly $3,500/month gross in most states), that program meaningfully offsets grocery costs. Families also frequently overlook WIC, which provides formula, dairy, and produce for children under five and nursing mothers.
Transportation – Target: 10–15%
BLS data shows transportation at 15–18% of average household spending – and for families earning $40–$60K, that share often runs higher because older, less reliable vehicles require more unplanned maintenance.
The full cost of car ownership goes beyond the monthly payment:
| Cost Component | Typical Annual Range |
|---|---|
| Car payment (used vehicle) | $3,600–$6,000 |
| Auto insurance | $1,500–$2,400 |
| Fuel | $2,000–$3,500 |
| Maintenance & repairs | $800–$1,500 |
| Total | $7,900–$13,400/year |
At $50K gross, that's 16–27% of income on one car. Two-car households in this income bracket frequently find that transportation is their second-largest expense after housing.
The most effective lever: buy used, pay cash, and avoid financing a car that costs more than 15% of your annual gross income. A $7,500 used vehicle paid in cash eliminates the $3,600–$6,000/year loan payment entirely.
Healthcare & Insurance – Target: 5–10%
For families without employer-sponsored coverage, the ACA Marketplace is the primary option – and at $40K–$60K household income, Premium Tax Credits (PTC) make it far more affordable than the sticker price suggests.
Here's how the three main plan tiers compare for a family of four in 2026:
| Plan Type | Monthly Premium (after PTC) | Family Deductible | Best For |
|---|---|---|---|
| Bronze | $50–$150 | $9,500–$15,000 | Healthy families, catastrophic coverage only |
| Silver | $250–$450 | $1,000–$3,500 (with CSR) | Most families in this income range |
| Gold | $500–$800 | $0–$2,500 | Families with frequent medical needs |
The Silver plan with Cost-Sharing Reductions (CSR) is the standout option for this income bracket. CSR subsidies – available only on Silver plans – dramatically reduce deductibles, copays, and out-of-pocket maximums. A family earning $45K may see a Silver plan deductible drop from $9,000 to under $2,000. That's the actual value most families overlook when they default to Bronze for the lower premium. Enrollment details and subsidy calculators are available at Healthcare.gov.
Utilities & Bills – Target: 5–8%
A typical household utility bundle – electricity, gas, water, trash, internet, and one cell phone line – runs $300–$500/month depending on region, home size, and usage habits.
Practical reductions that don't require major lifestyle changes:
- Programmable or smart thermostats cut heating and cooling bills by 10–15%
- Switching to a budget carrier (Mint Mobile, Visible) saves $30–$60/month per line versus major carriers
- LIHEAP (Low Income Home Energy Assistance Program) provides utility bill assistance for qualifying households – income thresholds often include families in the $40K–$55K range
Childcare & Education – Target: 0–15% (if applicable)
This is the category that breaks most $40K–$60K family budgets. According to ChildCareAware of America's Price of Care Landscape 2024, the average annual cost of center-based childcare in the U.S. is $12,406 per child – equivalent to 10% of a median dual-income household's earnings, and 35% of a single parent's income.
For a family earning $45K with one child in daycare, childcare alone consumes 27% of gross income. That leaves almost no room for savings, debt repayment, or discretionary spending.
Programs that reduce this burden:
- Child and Dependent Care Tax Credit: Covers up to 35% of care expenses (up to $3,000 for one child, $6,000 for two or more)
- Dependent Care FSA: Shelters up to $5,000/year in pre-tax dollars for care expenses – that's a $750–$1,100 actual tax savings depending on your bracket
- Head Start: Free early education and care for families at or near the poverty line
- Child Care Assistance Programs (CCDF): State-level subsidies for families below 85% of state median income – check your state's program, as income thresholds vary widely
The combination of a Dependent Care FSA and the Child and Dependent Care Tax Credit reduces effective childcare costs by $1,500–$2,500 per year for families in this income range. These two tools stack – the FSA covers the first $5,000 of expenses pre-tax, and the tax credit applies to qualifying expenses above that amount.
Debt Repayment – Target: 5–10%
Data from early 2026 shows the average American household carries roughly $178,000 in total debt – including a $255,000 mortgage, $31,000 in auto loans, $40,000 in student loans, and $8,200 in credit card balances.
For families in the $40–$60K range, the priority order for debt repayment is:
- Always pay minimums on everything – missed payments damage credit scores and trigger penalty rates
- Eliminate high-interest debt first (credit cards at 18–24% APR) – use the debt avalanche method to minimize total interest paid
- Keep student loan payments on Income-Driven Repayment (IDR) if cash flow is tight – IDR caps payments at 5–10% of discretionary income
If you want to see exactly how long your current debt payoff timeline looks, the Bromoney debt payoff calculator runs the avalanche vs. snowball comparison side by side with your actual balances and rates.
Savings & Emergency Fund – Target: 10–20%
The Federal Reserve's 2025 Economic Well-Being of U.S. Households report found that 40% of families earning $40K–$60K cannot cover an unexpected $400 expense without borrowing. The CFPB's data from the same period puts the median liquid savings balance for this group at just $2,500.
That's the gap this category exists to close.
The savings priority stack for this income range:
- $1,000 starter emergency fund – before anything else
- 401(k) contribution up to employer match – free money, always take it
- High-interest debt elimination
- Full 3–6 month emergency fund ($6,000–$18,000 depending on monthly expenses)
- Roth IRA and additional retirement contributions
CFPB and FDIC materials consistently recommend "at least three to six months' worth of expenses in an emergency savings fund" as the baseline for financial resilience. For a family spending $2,500–$3,500/month on essentials, that means a target of $7,500–$21,000 – a number that feels distant but compounds quickly when savings are automated.
Personal & Discretionary Spending – Target: 5–10%
Discretionary spending covers everything that isn't a fixed obligation: dining out, streaming services, clothing beyond basics, hobbies, and entertainment.
BLS Consumer Expenditure Survey data shows that entertainment, apparel, and subscriptions represent 5–10% of average household spending. For families in the $40–$60K range, this is typically the first category to compress when housing or childcare runs over budget.
A practical audit: list every recurring subscription and cancel anything unused in the past 30 days. Most households carry $60–$120/month in forgotten subscriptions – that's $720–$1,440/year that could fund three months of Roth IRA contributions or accelerate an emergency fund from $1,000 to $2,500.
Behavioral finance research supports the idea that physical awareness of spending – whether through cash, envelope budgeting, or a deliberate monthly review – reduces impulse purchases more reliably than willpower alone. For a deeper look at how behavioral finance and cash usage affect discretionary spending patterns, that Bromoney breakdown covers the mechanism directly.
How Much Should a Family of 4 Save on $40K–$60K Income?
Building a $1,000 Starter Emergency Fund First
Before retirement accounts, before extra debt payments, before anything else – build a $1,000 cash buffer in a separate savings account. This single step breaks the cycle where every car repair or medical copay goes straight onto a credit card at 20%+ APR.
The $1,000 target isn't arbitrary. It covers the most common financial emergencies: a car breakdown, a medical bill, a home appliance failure. It won't cover everything, but it stops the debt spiral long enough to build from.
Keep this money in a high-yield savings account (currently paying 4.5–5.0% APY at most online banks) – not in a checking account where it blends with spending money. The separation is intentional: out of sight, out of reach for impulse decisions.
Retirement Savings: 401(k) and Roth IRA Options
Vanguard's How America Saves 2024 and Fidelity's retirement savings guidelines both recommend directing at least 15% of gross income toward retirement, including any employer match. For a family earning $50K, that's $7,500/year. That number feels impossible when you're covering childcare and rent – but sequencing matters more than the total amount.
The 2026 contribution limits:
- 401(k): $24,000/year employee contribution limit
- Roth IRA: $7,500/year (includes catch-up contribution for age 50+)
The priority sequence, per CFP Board consensus:
- Contribute to 401(k) up to the full employer match – this is a guaranteed 50–100% return on that money
- Max out Roth IRA – at $40–$60K income, you're in a relatively low tax bracket; paying taxes now and withdrawing tax-free in retirement is the right trade
- Return to 401(k) for additional pre-tax contributions if budget allows
At this income level, the Roth IRA is particularly valuable. Your current federal effective rate (9–12%) is almost certainly lower than your rate in retirement if savings grow as intended. Locking in today's rate is the smart play. IRS Publication 590-A covers Roth IRA contribution limits and eligibility rules in full.
Saving for Kids: 529 Plans on a Tight Budget
Opening a 529 college savings account doesn't require a large upfront commitment. Most state plans have no minimum opening balance, and many accept contributions as low as $1–$25. The average historical return for a moderate age-based portfolio runs 5–8% annually, per the College Savings Plans Network.
Thirty-plus states offer a state income tax deduction or credit on 529 contributions – check your state's plan at Saving for College before opening an account elsewhere.
For families on a tight budget, three micro-saving strategies work well:
- Automate $10–$25/week – $520–$1,300/year compounds meaningfully over 15 years
- Use Ugift (or similar platforms) to let grandparents and relatives contribute at birthdays and holidays instead of buying toys
- Direct part of your tax refund to the 529 each spring – a $500 contribution doesn't affect monthly cash flow
One regulatory update worth knowing: since 2024, unused 529 balances (up to $35,000) roll over into the beneficiary's Roth IRA, which removes the old "what if my kid doesn't go to college" objection entirely.
Key sources on retirement savings priorities:
- Vanguard: How America Saves 2024 – recommends 15% gross income including employer match
- Fidelity: Retirement Savings Guidelines – targets 1x salary saved by age 30
- CFP Board: Financial Planning Competency Handbook – prioritization framework for debt vs. savings decisions
- IRS Publication 590-A: Roth IRA contribution limits and eligibility rules
Sample Monthly Budget Templates
Sample Budget: Family of 4 on $40,000/year (~$2,700/month net)
| Category | Monthly Amount | % of Net |
|---|---|---|
| Housing (rent/mortgage) | $900 | 33% |
| Groceries | $700 | 26% |
| Transportation | $350 | 13% |
| Utilities & phone | $250 | 9% |
| Healthcare/insurance | $200 | 7% |
| Debt minimums | $150 | 6% |
| Savings (emergency fund) | $100 | 4% |
| Discretionary | $50 | 2% |
| Total | $2,700 | 100% |
At $40K, there is almost no margin. Childcare would require cutting housing, transportation, or debt payments. This is a bare-bones budget that requires geographic flexibility and likely SNAP, CHIP, and ACA subsidy eligibility. The Bromoney credit utilization calculator can help you assess whether existing debt is crowding out savings capacity.
Sample Budget: Family of 4 on $50,000/year (~$3,400/month net)
| Category | Monthly Amount | % of Net |
|---|---|---|
| Housing (rent/mortgage) | $1,100 | 32% |
| Groceries | $800 | 24% |
| Transportation | $400 | 12% |
| Utilities & phone | $280 | 8% |
| Healthcare/insurance | $300 | 9% |
| Childcare (if applicable) | $500 | 15% |
| Debt minimums | $200 | 6% |
| Savings / 401(k) match | $200 | 6% |
| Discretionary | $120 | 4% |
| Total (with childcare) | $3,900 | 115% |
With childcare, this budget runs a $500/month deficit – which is why the Dependent Care FSA, Child Tax Credit, and ACA subsidies aren't optional at this income level. Without childcare, the budget has roughly $500/month of breathing room for increased savings and discretionary spending.
Sample Budget: Family of 4 on $60,000/year (~$3,900/month net)
| Category | Monthly Amount | % of Net |
|---|---|---|
| Housing (rent/mortgage) | $1,300 | 33% |
| Groceries | $900 | 23% |
| Transportation | $450 | 12% |
| Utilities & phone | $320 | 8% |
| Healthcare/insurance | $350 | 9% |
| Childcare (if applicable) | $600 | 15% |
| Debt minimums + extra | $250 | 6% |
| Savings / 401(k) + Roth | $380 | 10% |
| Discretionary | $250 | 6% |
| Total (with childcare) | $4,800 | 123% |
At $60K with childcare, the deficit narrows but doesn't disappear. The Child and Dependent Care Tax Credit and Dependent Care FSA together recover $150–$200/month in effective savings. Without childcare, this income level allows for a genuine 10–15% savings rate and meaningful debt payoff.
Budgeting Methods That Work for $40K–$60K Families
Zero-Based Budgeting
Zero-based budgeting assigns every dollar of income to a specific category – housing, groceries, savings, debt – until the equation reads: Income minus all allocations equals zero. Nothing floats unassigned.
The method works well for families with irregular income (freelancers, hourly workers with variable hours) because it forces a monthly reconciliation. The tradeoff is time: it takes 30–60 minutes at the start of each month to build the budget, and ongoing tracking throughout.
In practice, the families who stick with zero-based budgeting longest are those who treat the monthly setup as a fixed appointment – same night, same time, every month. The ritual matters as much as the math.
Best for: Families who feel like money "disappears" without knowing where it went, or households with variable monthly income.
Envelope Method / Cash Stuffing
The envelope method divides discretionary spending into physical categories – groceries, gas, dining out, entertainment – and loads each envelope with cash at the start of the month. When the envelope is empty, that category is done until next month.
The behavioral finance research behind this is solid: physical cash creates a more tangible spending experience than tapping a card, which reduces impulse purchases. For families consistently overspending on groceries or dining out, the envelope method addresses the mechanism directly. Building financial stability without credit is one documented benefit for households that rely primarily on cash-based systems.
Digital versions – through apps like Goodbudget or the envelope feature in YNAB – replicate the logic without requiring cash. For a deeper look at how the method evolved and how to apply it, the traditional budgeting rules breakdown on Bromoney traces the system from its origins to current digital adaptations.
Best for: Families who overspend on variable categories and need a hard stop mechanism.
The Dave Ramsey Baby Steps Approach
Dave Ramsey's seven-step framework is the most structured debt-elimination system in mainstream personal finance. The first three steps are directly relevant to $40–$60K families:
- Save $1,000 starter emergency fund
- Pay off all non-mortgage debt using the debt snowball (smallest balance first)
- Build a 3–6 month emergency fund
The snowball method – paying minimums on everything, then throwing all extra cash at the smallest balance – isn't mathematically optimal. The debt avalanche (highest interest rate first) saves more money. But Ramsey's framework and the behavioral finance literature consistently show that the psychological momentum of eliminating a balance completely keeps people on track longer than the avalanche method, even when the avalanche saves more in interest.
For families carrying multiple debts – a car loan, two credit cards, and student loans – the Baby Steps provide a clear sequence that removes decision fatigue.
Best for: Families with significant consumer debt who need a structured, motivational framework.
Apps and Tools: YNAB, EveryDollar, Mint
As of 2026, the three tools most relevant to families in this income range:
| App | Cost (2026) | Method | Best Feature | Rating |
|---|---|---|---|---|
| YNAB | ~$105/year | Zero-based | Proactive allocation, goal tracking | 4.8/5 |
| EveryDollar | Free / $99.99/year (Ramsey+) | Zero-based / Baby Steps | Free version functional without bank sync | 4.6/5 |
| Credit Karma | Free | Account overview | Credit monitoring | 3.5/5 (budgeting) |
Mint closed in 2024. Its replacement, Credit Karma, monitors credit scores and account balances but doesn't support active budget management. It's not a functional replacement for families who used Mint to track spending categories.
For families who want to track budgets across multiple devices without manual data entry, the syncing budget categories across devices comparison covers how digital envelope apps handle bank connections and category syncing in detail.
The Bromoney app (Android / iOS) lets you set up budget categories and track monthly spending without a paid subscription.
Common Budget Challenges for Families in This Income Bracket
When Housing Costs Exceed 30% of Income
HUD defines "cost-burdened" as spending more than 30% of gross income on housing. By that definition, a significant share of $40–$60K families in coastal metros are cost-burdened by default – before they've spent a dollar on food or transportation.
When housing exceeds 30%, the realistic options are:
- Increase income through a second job, freelance work, or a raise negotiation
- Reduce housing cost by moving, taking in a roommate, or refinancing at a lower rate
- Compress other categories – but this only works if there's genuine discretionary spending to cut, which many families in this bracket don't have
House hacking works repeatedly in practice: renting a spare bedroom for $600–$900/month brings a $1,400 rent payment down to an effective $500–$800 – well inside the 30% threshold even at $40K income. It requires comfort with a housemate, but it's the fastest single lever available without changing jobs or moving cities.
For families considering whether a personal loan could bridge a temporary housing gap, the Bromoney personal loans hub outlines options without requiring a hard credit pull to compare rates.
Managing Childcare Costs on a Limited Income
Childcare is the most financially disruptive line item in a $40–$60K family budget. At $12,406/year average for center-based care (ChildCareAware of America, Price of Care Landscape 2024), one child in full-time daycare consumes 21–31% of gross income at this income level.
The stacking strategy that works:
- Enroll in Dependent Care FSA at open enrollment – $5,000 pre-tax contribution saves $750–$1,100 in actual taxes
- Claim the Child and Dependent Care Tax Credit on your return – this is separate from the FSA and applies to qualifying expenses above the FSA amount
- Apply for CCDF subsidies through your state – income thresholds often extend to 85% of state median income, which includes many $40–$60K households
- Consider in-home daycare (family daycare providers) – typically 20–40% less expensive than center-based care with comparable quality in many markets
For context on how to avoid common pitfalls when stretching a tight budget across multiple categories simultaneously, the avoiding budget shortages guide on Bromoney covers the failure patterns we see most often.
Paying Off Debt While Saving – Prioritization Guide
The tension between debt repayment and savings is the most common question in family financial planning. The answer isn't "one or the other" – it's sequencing.
The framework that financial planners and the CFP Board consistently recommend:
| Step | Action | Why |
|---|---|---|
| 1 | Build $1,000 emergency fund | Prevents new debt from every small emergency |
| 2 | Contribute to 401(k) up to full employer match | 50–100% guaranteed return – mathematically unbeatable |
| 3 | Pay off high-interest debt (>10–12% APR) | Credit card interest at 20%+ costs more than investments earn |
| 4 | Expand emergency fund to 3–6 months | Protects against job loss without credit card dependency |
| 5 | Increase retirement contributions; open Roth IRA | Tax-advantaged compounding over decades |
| 6 | Invest extra cash; pay down low-rate debt (mortgage) | At rates below ~7%, investing likely outperforms early payoff |
For families who want to model their specific debt situation, the Bromoney DTI calculator shows how your current debt load affects borrowing capacity, and the debt payoff calculator runs avalanche vs. snowball projections with your actual balances and rates.
How to Adjust Budget Categories if Income Changes
If Income Drops Below $40K
A drop below $40K requires an immediate shift to a bare-bones budget: every non-essential category compresses to zero until cash flow stabilizes.
The sequence for cutting:
- Discretionary spending first – subscriptions, dining out, entertainment, non-essential clothing
- Savings rate reduction – pause Roth IRA contributions; maintain 401(k) only to the employer match
- Debt payments to minimums only – protect your credit score, but stop extra payments
- Utility and phone optimization – switch to budget carriers, reduce thermostat settings, pause streaming services
Government programs become critical below $40K. Reassess eligibility for SNAP, CHIP, LIHEAP, and ACA subsidies immediately – income changes trigger a Special Enrollment Period on the Marketplace.
If the income drop is temporary and you need a short-term bridge, Bromoney's emergency loan options compare lenders without requiring a hard credit pull upfront.
If Income Rises Above $60K – Lifestyle Creep Warning
The Federal Reserve's Survey of Consumer Finances (2025) found that 45% of households earning $30K–$75K couldn't cover a $500 unexpected expense without borrowing – despite income levels that should allow for savings. The primary driver: spending grows in lockstep with income.
Lifestyle creep is quiet. It looks like a nicer apartment when you move, a newer car when the old one is paid off, more restaurant meals because you can finally afford them. Each individual decision is reasonable. The aggregate leaves you financially fragile at $70K the same way you were at $45K.
The rule that prevents it: when income increases, direct at least 50% of the raise to savings and debt payoff before adjusting your lifestyle budget. If take-home increases by $400/month, put $200 into retirement or an emergency fund first. Spend the other $200 on whatever you want. This single habit – applied consistently – is the difference between building wealth and just earning more.
Frequently Asked Questions
Is $50,000 a year enough for a family of 4?
By MIT Living Wage Calculator standards (2026), $50,000 per year is not sufficient for a family of four in any U.S. state. The living wage for a two-adult, two-child household starts at approximately $85,000/year in the most affordable regions of the country – a figure that aligns closely with the $83,730 real median household income reported by FRED for 2024.
That doesn't mean $50K families can't manage – many do, through geographic flexibility, government assistance programs (SNAP, CHIP, ACA subsidies, EITC), and careful budgeting. But there is almost no margin for error, and savings accumulation is slow without tax credits and employer benefits.
What percentage of income should go to groceries for a family?
The standard recommendation is 10–15% of net (take-home) income. For a family netting $3,000/month, that's $300–$450. The USDA Thrifty Food Plan for a family of four runs approximately $850–$950/month – which at $3,000 net represents 28–32%. That gap is why grocery budgeting is one of the highest-leverage areas for families in this income range.
A practical target: aim for the USDA Low-Cost plan (~$1,000–$1,100/month for a family of four) and treat the Thrifty plan as your floor during tight months.
How much should a family save per month on a $60K salary?
At $60,000 gross, the standard 20% savings guideline translates to $1,000/month ($60,000 × 0.20 ÷ 12). That includes retirement contributions, emergency fund deposits, and any debt payoff above minimum payments.
Realistically, a family of four at $60K with childcare will find 20% difficult. A more achievable near-term target: 10–12% ($500–$600/month), prioritized as 401(k) match first, then Roth IRA, then emergency fund top-up.
What is the 50/30/20 rule for a $45,000 salary?
At $45,000 gross, estimated monthly net income is approximately $2,900 (after federal tax, FICA, and standard deductions in a no-state-tax state).
The 50/30/20 breakdown:
| Category | Percentage | Monthly Amount |
|---|---|---|
| Needs (housing, food, transport, healthcare) | 50% | $1,450 |
| Wants (dining out, entertainment, hobbies) | 30% | $870 |
| Savings & debt payoff | 20% | $580 |
For a family of four, the Needs bucket at $1,450 is tight – housing alone often runs $900–$1,100 in moderate-cost markets. Most families at this income level operate closer to a 65/15/20 split in practice, compressing wants to fund the needs category.
The information in this article reflects 2026 tax parameters and publicly available financial data. Individual results vary based on state of residence, family size, employer benefits, and eligibility for federal assistance programs. This content is for educational purposes and does not constitute personalized financial advice.

Denis Goncharenko
Managing Editor & FinTech Content Strategist
Editorial Policy: Denis ensures every financial claim is backed by institutional data sources.
Was this article helpful?
Same blogs

How Your Budget Changes After Having a Baby: Real Numbers for U.S. Families
A practical U.S. guide to the monthly budget shock after having a baby, including childcare, healthcare, tax benefits, and first-year planning.

The Real Cost of Elder Care: How Caring for Aging Parents Affects Your Family Budget
A practical guide to the real cost of elder care in the U.S., including home care, assisted living, nursing homes, hidden income loss, taxes, and family budgeting.

Financial Arrangements in a Prenup: What You Can (and Can't) Include
A practical guide to financial clauses in U.S. prenuptial agreements: assets, debts, alimony, business ownership, disclosure, state law, and what courts will not enforce.