


Saving Money on Groceries Is Not a Test of Willpower
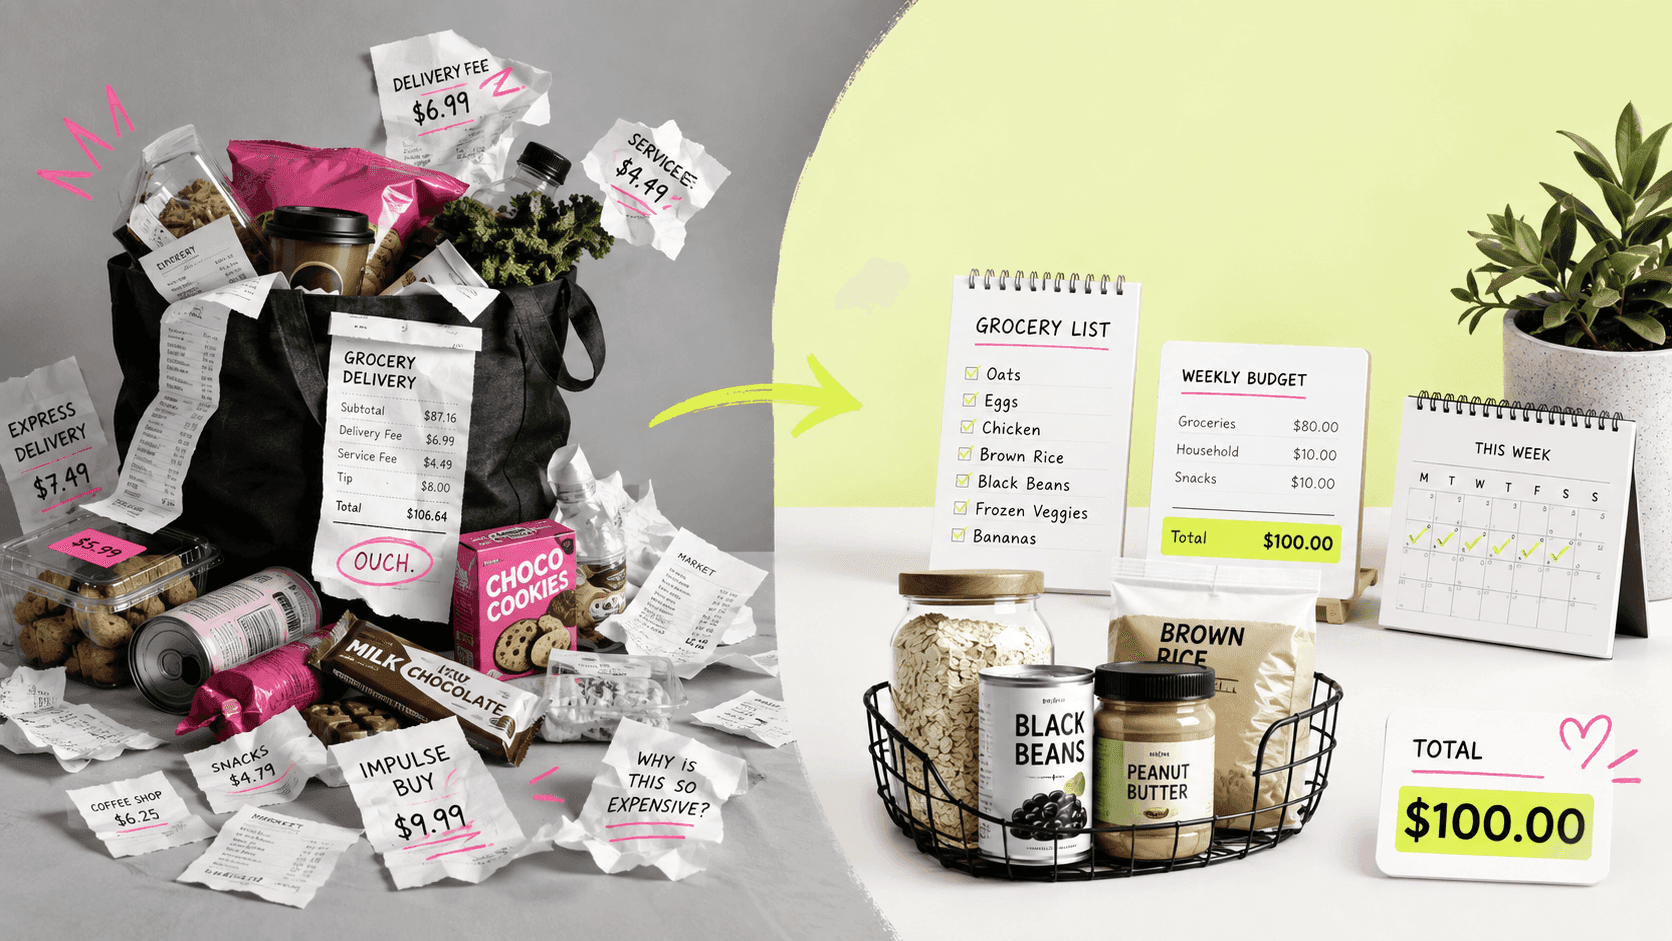
Saving Money on Groceries Is Not a Test of Willpower
Most advice about groceries starts by assuming the problem is you: you shop hungry, you fill the cart with what you don't need, you lack discipline. Federal price data does not describe that problem. It describes a basket whose six parts moved at six different rates over the past year - five up, one down. That is a measurement problem rather than a character one.
The measurement problem has a fix, and it is not another set of grocery shopping tips. Most ways to save money on groceries are ranked by how clever they sound rather than by how much they move, and none of that ranking survives contact with a household that has not measured its own basket. So this page starts one step earlier: which number to build on. That turns out not to be the national average, and not the official forecast either. It is your own receipts from the past eight to twelve weeks, read in a particular way.
What actually happened to grocery prices this year
Over the twelve months ending in July 2026, the food-at-home index rose 2.7 percent. The all-items index rose 3.4 percent over the same period.
That ordering matters, because it runs against the usual framing. Groceries did not lead this round of increases - they trailed the overall basket. Apparel rose 3.9 percent, recreation 2.6 percent, gasoline 24.6 percent, and airline fares 25.5 percent over those same twelve months.
Source: BLS Consumer Price Index, July 2026, released August 12, 2026. Twelve-month changes, not seasonally adjusted.
So if your grocery bill feels like it grew faster than 2.7 percent, the national figure is not calling you wrong. It is describing a basket that is not yours - which is why every general answer to how to save on groceries starts from the wrong place.
The six grocery groups did not move together
BLS splits food at home into six major grocery store food groups. Over the twelve months ending July 2026, they moved like this:
| Grocery group | 12-month change |
|---|---|
| Fruits and vegetables | +5.1% |
| Nonalcoholic beverages | +4.1% |
| Cereals and bakery products | +2.7% |
| Other food at home | +2.5% |
| Meats, poultry, fish, and eggs | +1.9% |
| Dairy and related products | -0.5% |
Source: BLS CPI July 2026.
The distance between the top and bottom rows is 5.6 percentage points, and the bottom row is negative - dairy got cheaper while produce got more expensive. The 2.7 percent headline is a weighted blend of those six, weighted by what urban consumers buy on average.
These are national indexes for whole categories, not the inflation rate of anyone's cart: no household "experienced +5.1 percent." What the spread does establish is that the blended figure sits on top of components pulling in opposite directions, so it cannot stand in for a particular basket. That is not a flaw in the statistic - it answers a national question, and yours is a household question.
Spending is not prices, and the two disagree
Prices are one measurement. What people actually spend is a separate one, collected by a separate survey, and the two do not have to agree.
The Consumer Expenditure Survey tracks spending. Its 2024 edition, released December 19, 2025, reports groceries this way:
| CES line | 2023 -> 2024 | Change | Statistically significant? |
|---|---|---|---|
| Food at home | $6,053 -> $6,224 | +2.8% | no |
| Cereals and bakery products | $830 -> $779 | -6.1% | yes |
| Dairy products | $602 -> $631 | +4.8% | yes |
| Food away from home | $3,933 -> $3,945 | +0.3% | no |
| Average annual expenditures, all categories | $77,158 -> $78,535 | +1.8% | no |
Source: BLS Consumer Expenditure Surveys 2024. "Significant" means the change carries an asterisk in table A - it cleared the 95 percent bar.
Read the first row carefully. It rose 2.8 percent, and that change did not clear the 95 percent bar - the survey cannot distinguish it from zero. That is not the same as nothing happening; the estimate simply is not precise enough to show it.
One line inside the total did clear the bar, downward: cereals and bakery products, -6.1 percent - the only statistically significant decrease anywhere in the 2024 table. Another rose. Inside an aggregate that barely moved, both were large enough to measure, and the aggregate hid them.
Food, in total, took 12.9 percent of the household total in 2024 - against 33.4 percent for housing and 17.0 percent for transportation. That share is worth holding onto before you spend a weekend optimizing it. The HUB piece works through how we compare official U.S. spending data across household categories, and groceries sit lower in that ranking than their emotional weight suggests.
One caution. What a household lays out can shift because tags moved, because it bought different things, because it changed size, or because the sample did. Setting the two surveys side by side is arithmetic, not an explanation: where they diverge, the honest phrasing is consistent with, never because of.
Why next year's forecast can't be your baseline
If the average is the wrong anchor, the forecast is a worse one - and the agency publishing it says so in the same breath.
USDA's Economic Research Service publishes the Food Price Outlook monthly, with a 95 percent forecast interval attached to every figure. As of the August 25, 2026 update:
| Year | Index | Forecast | 95% forecast interval |
|---|---|---|---|
| 2026 | All food | +3.0% | 2.4 to 3.5% |
| 2026 | Food at home | +2.5% | 1.7 to 3.3% |
| 2026 | Food away from home | +3.6% | 3.2 to 3.9% |
| 2027 | All food | +2.4% | -3.0 to 8.1% |
| 2027 | Food at home | +2.1% | -5.7 to 10.5% |
| 2027 | Food away from home | +2.7% | 0.0 to 5.5% |
Source: USDA ERS Food Price Outlook, Summary Findings, updated August 25, 2026.
The 2027 grocery interval is 16.2 percentage points wide and straddles zero on both sides. The official forecast is compatible with those prices falling almost 6 percent next year, and with them rising more than 10 percent.
That is not a knock on the method - ERS fits statistical models to recent data, publishes the interval openly, and notes that it narrows as the year fills in. The point is what that much room means for you: an interval that wide is a set of scenarios to prepare for, not a number to budget against. Ask what a 10 percent year would do to you - but do not treat the midpoint as a figure to spend to.
One note, because it trips people up: ERS averages all months of one year against all months of the previous one, not year-over-year from the month of the forecast. Its figures and twelve-month CPI figures are built differently and should never be added together.
Start from your own last 8 to 12 weeks
Here is the alternative baseline, and it takes nothing but an evening. Everything people usually mean by learning how to save money on groceries - switching stores, switching brands, buying in bulk, planning meals - is a decision you cannot evaluate until this part is done.
Pull every such transaction from the past eight to twelve weeks out of your bank or card statement. That window is a practical compromise, not a tested rule: much less and one restocking trip dominates the result, much more and your habits have drifted enough that you are no longer measuring the present. Pick a length and keep it the same every time you redo this.
Then do four things with the list, in this order:
- Total the window, then convert it - carefully. Divide the total for the window by the number of weeks in it to get a weekly figure, then multiply by 52 and divide by 12. Do not multiply the weekly figure by 4: months average about 4.33 weeks, so multiplying by 4 understates the year by roughly 8 percent. USDA uses the same 52-divided-by-12 conversion in its monthly food plan figures.
- Take the median week as a separate diagnostic. The median tells you what an ordinary week looks like, which is useful for spotting drift. It is not your monthly budget, and it is not necessarily the week you repeat most often - it is only the middle one once the weeks are sorted.
- Pull the rare, large purchases out and annualize them. The quarterly warehouse run and the holiday shop belong in the year, not in an ordinary week. Add them up over a year, divide by 12, and carry that as its own line.
- Count the number of trips, not just the total. Two households laying out the same amount across four trips and eleven trips are running different systems, and the eleven-trip household has more places to change something.
What you now have is a monthly figure with your own name on it, plus a separate line for the lumpy items. Every later decision compares against that, rather than against a national mean.
What to pull, and what to leave out
Bank statements label things loosely, and the label is where most household tallies go wrong.
Count as groceries: whatever comes home from the grocery store to prepare or eat there, including the paper goods and cleaning supplies bought in the same trip if you cannot separate them from the receipt. Consistency matters more than category purity - just do the same thing every week.
Do not count: restaurant meals, coffee bought out, work lunches, meal-kit subscriptions, and takeout. These are a different measurement with a different price trend behind them - food away from home rose 3.4 percent over the twelve months ending July 2026, against 2.7 percent for food at home. Mixing them means you cannot tell which one is moving.
(Insertion point: link to the eating-out article, E1, once published.)
Flag separately: the big quarterly warehouse run, alcohol, and anything bought for a party or a holiday. Do not delete these - they are real spending. Keep them visible as their own line so they stop contaminating your median week.
Separate the delivery from the food
If you order groceries for delivery, the receipt total is at least four numbers stacked together: the food, the service fee, the delivery fee, and the tip. Some services also price items above shelf price, which makes a fifth number that never appears as a line.
Split them. Add up the fees and tips across the whole eight-to-twelve-week window, and look at that subtotal on its own.
Convenience and provisions are separate decisions, and stacking them hides both. One household will find the fees worth every cent, since delivery replaces an hour of driving and two impulse aisles; another will find that subtotal has quietly become the largest controllable item in the window. Neither conclusion is reachable while the two sit inside one figure. Nothing here says stop ordering delivery - it says price it, then decide.
Find the items you buy every single time
Sort your receipts by how often an item shows up rather than by its size on the receipt. This is the one step that will help you save money without changing a thing on the list itself.
What usually emerges is a short grocery list that repeats in nearly every shop - milk, eggs, bread, coffee, the same pasta, the same cereal, the same cleaning spray. We have no survey telling us how long that list runs, and the number is not the point; sort your own and see where it ends. That list, not the total, is where a repeatable change lives, because a repeating item multiplies whatever you do to it by however many weeks are left in the year. A one-time swap on a holiday roast does not.
This is also the honest reason advice on how to meal plan on a budget helps some households and does nothing for others. The mechanisms usually claimed for it are fewer duplicate purchases of things you already own and fewer trips to buy groceries - we have not found a study isolating either effect, so treat them as hypotheses to test on your own numbers. If your core list is already tight and your trip count already low, there is little left for planning to act on, whatever the guides promise.
Two things this exercise is not. It is not a diet - this page has no opinion on what belongs on your list nutritionally, which is a question for a professional who knows your circumstances. And it is not a demand that you drop anything. It is a ranking, so you know which decisions carry leverage.
(Insertion point: link to the impulse-buying article, B1, once published.)
Unit price: the number the shelf tag often gives you
Unit price is the cost per standardized measure - per ounce, per pound, per liter, per hundred sheets. Many retailers print it in small type beside the package price, in which case the comparison work is already done and simply not being read. Do not assume it will be there: only ten states and the District of Columbia require unit pricing, nine more have voluntary provisions, and thirty-three states have no unit pricing provisions in force at all (NIST, Guide to U.S. Retail Pricing Laws and Regulations). Where it is missing, the division is yours to do.
It answers one question well: for the same item in different sizes or brands, which one costs less per unit. It is the correct number for the repeat list from the previous section, where the same item comes back week after week. Of everything filed under saving at the grocery store, this is the part the store may have already done for you.
Three cautions, because it gets oversold:
- The units have to agree. Two brands priced per ounce compare cleanly; one per ounce against one per item does not.
- Lower unit price is not lower spending if the food does not get eaten. The larger container wins on the tag and loses in the bin. That is the next section.
- It says nothing about quality, and nothing about nutrition. It is a division problem, not a judgment.
Used narrowly - same item, same units, items you genuinely buy every week - it is the most reliable single tool on this page, because where the grocery store has done the division, it relies on a computed number rather than anyone's estimate.
Measure what you throw away before you trust a number
Food that gets bought and not eaten is spending with nothing to show for it, and it is the part of the total nobody has receipts for.
The scale of the issue at national level is documented. USDA's Economic Research Service estimated that in 2010, food loss at the retail and consumer levels came to 31 percent of the available food supply - about 133 billion pounds, valued at $161.6 billion at retail prices.
Source: USDA ERS, Loss-Adjusted Food Availability documentation.
Three things that figure does not say, and they matter more than the figure:
- It is an estimate for 2010. It is sixteen years old, and ERS notes such estimates describe one point in time and shift as retail prices shift.
- It measures the national food supply, not your receipts. "31 percent of food goes uneaten" does not translate to "31 percent of your grocery money is wasted" - weight and dollars are different units, and a household's share is its own.
- It combines retail and consumer levels. Some of that loss never reached anyone's kitchen.
Which is why it belongs here as a reason to measure, not a promise. The share is large enough nationally to be worth a couple of weeks of bookkeeping: keep a note on the fridge, write down what gets thrown out and roughly what it was worth. Two weeks is an arbitrary starting point, not a validated one - run it longer if your shopping cycle is longer. If waste turns out to be a real line for you, it overturns the unit-price rule above. The bigger container stops being cheaper the moment part of it is discarded.
What this method will not do for you
Being clear about limits is part of the method.
It will not halve what you spend. Advice promising to halve the total circulates widely and rarely comes with a baseline. Halving is arithmetically available only where there is that much slack to remove - heavy delivery use, takeout counted as groceries, a very high trip count. We know of no measurement of how often that is the case. A household that already makes four trips a month from a fixed list has far less room, and no method invents room that is not there.
It will not protect you from prices. Nothing on this page changes the +5.1 percent on produce. Measuring tells you where you stand and which decisions carry weight - it shows you where you can reduce food costs and where you cannot. It is not a hedge.
It does not settle whether cheaper is worse. Switching brands, sizes or stores may change what lands on the table, and this page is not the place to judge that trade-off. Federal Reserve survey data shows that 62 percent of adults switched to cheaper products during 2025 and 60 percent used less or stopped using products altogether (SHED 2025, table 16, fielded October 17-28, 2025). Both behaviors are widespread. The survey records what people changed, not whether they were better or worse off after.
It assumes there is something to work with. The same survey found 8 percent of adults sometimes or often did not have enough to eat. Budgeting method is not the relevant tool at that point; food assistance is. A household in that position should check SNAP eligibility and contact its state agency rather than open a spreadsheet.
Frequently asked questions
How much should I spend on groceries each month?
No figure we could give you would be responsible: the answer turns on household size, ages, region and dietary needs, none of which a page knows. The official reference is the USDA Food Plans - four plans at rising cost levels (Thrifty, Low-Cost, Moderate-Cost, Liberal), each setting quantities for healthy meals at home, published by age and sex and adjusted monthly for inflation using CPI-U. The Thrifty plan sets maximum SNAP allotments. Take the current month's report from USDA Food and Nutrition Service rather than a number from any article, this one included.
What is a reasonable grocery budget?
Operationally: one you hit three months running without a mid-month correction. If you have to raid another category every month, the figure is not a budget, it is a wish. Start from the converted monthly figure above, and change it deliberately from there.
How do I make a grocery budget, step by step?
To calculate one: pull eight to twelve weeks of transactions, excluding the rare large restocks; divide the total by the number of weeks in your window; multiply that weekly figure by 52 and divide by 12. Multiplying by 4 instead understates the result by roughly 8 percent, because the average month runs about 4.33 weeks. Then add the annualized restocks as their own monthly line. Review after a full month against actual receipts.
Can I really cut my grocery bill in half?
Most households cannot, and the claim usually omits the starting point. It is plausible where a lot of takeout or delivery was being counted as groceries, and implausible for a household already buying from a fixed list on a low trip count. Measure first - the size of your slack sets the size of your result.
Does meal planning actually save money on food?
It is the most frequently promised route to how to save money on food, and the least often quantified - we found no study putting a figure on it. The two mechanisms usually claimed are fewer duplicate purchases and fewer trips. If your core list is short and your trip count already low, both have little to act on. The size of the effect is a property of your current pattern, not of planning itself.
Is grocery delivery making my bill bigger?
Add up service fees, delivery fees and tips across eight to twelve weeks and look at that subtotal alone; some services also charge above shelf price, which never appears as a line. Then weigh it against what delivery replaces - driving time, and the aisles you do not walk down. The comparison is only possible once the two figures are apart.
Sources and when they update
| Source | What it provides here | Latest edition used | Update cycle |
|---|---|---|---|
| BLS Consumer Price Index | Twelve-month changes for food at home, the six grocery groups, all items | July 2026, released August 12, 2026 | Monthly |
| BLS Consumer Expenditure Survey | Household outlays on groceries, significance testing, category shares | 2024, released December 19, 2025 | Annual |
| USDA ERS Food Price Outlook | Forecasts and forecast intervals for 2026 and 2027 | Updated August 25, 2026 | Monthly |
| USDA ERS Loss-Adjusted Food Availability | National food loss estimate, 2010 | 2010 estimate | Irregular |
| USDA Food Plans | Official reference figure by age and sex | Current month | Monthly |
| Federal Reserve SHED | Share of adults switching to cheaper products; food sufficiency | 2025, fielded October 17-28, 2025 | Annual |
Figures on this page were checked against these releases on August 27, 2026. Where a release has since been revised, the release governs.

Denis Goncharenko
Head of Content
Editorial Policy: no secondary statistics. Every claim is linked to an official source and dated — datasets and methods are open for review.

Was this article helpful?
Same blogs
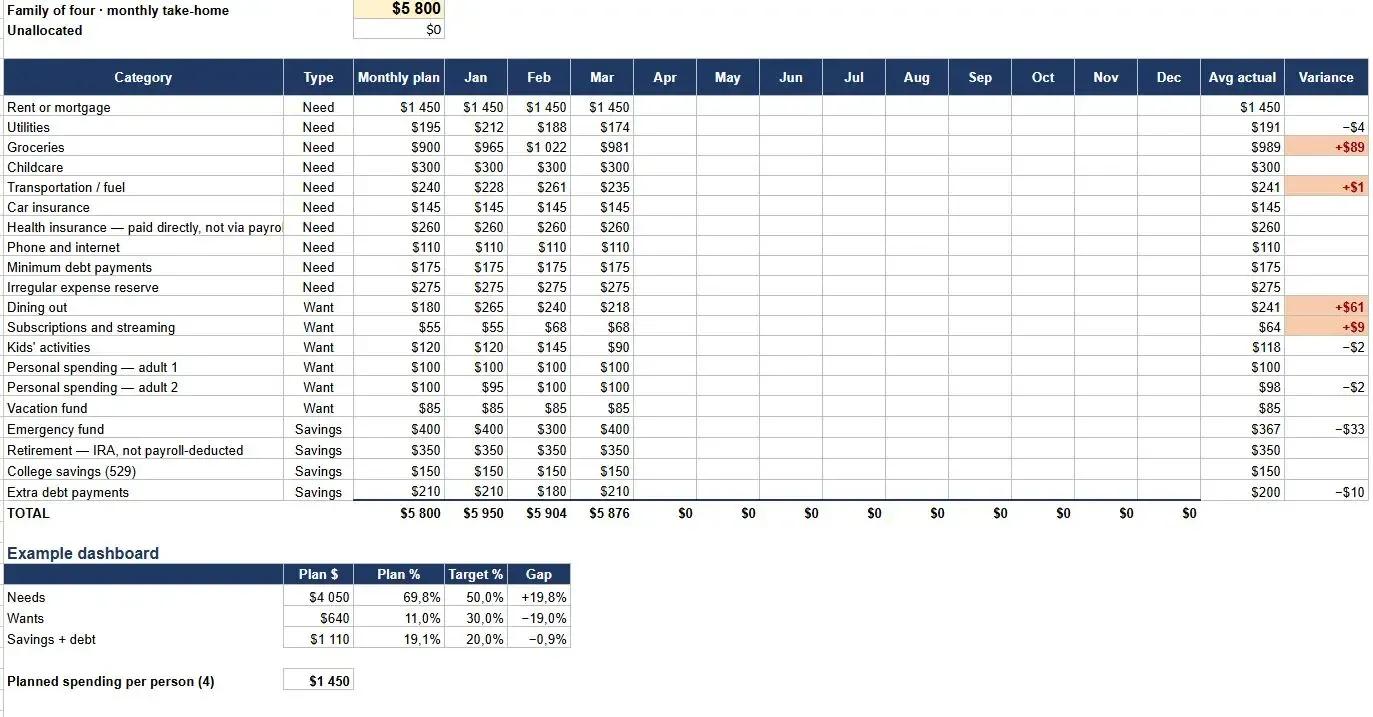
Free Family Budget Template for Excel and Google Sheets
A free household budget spreadsheet for families of three to five, with categories pre-filled and a separate tab that spreads yearly bills like insurance and registration across all twelve months. No email, no sign-up, works in Excel and Google Sheets.

Why Parent PLUS Loans Have Become a Hidden Retirement Crisis for American Parents
Parent PLUS loans can follow parents into retirement, reduce savings, and expose Social Security benefits to offset after default. Here is what near-retirement borrowers should know.

Parent PLUS Loans: How to Manage Them and Protect Your Retirement
Parent PLUS Loans can collide with retirement savings. Learn how repayment plans, consolidation, PSLF, refinancing, and cash-flow priorities work in 2025-2026.