


What Average Household Expenses Show About Price Pressure - and What They Can't
What Average Household Expenses Show About Price Pressure - and What They Can't
The average U.S. consumer unit spent $78,535 in 2024 - about $6,545 per month when the annual mean is divided by twelve. BLS reports these figures per consumer unit, not per Census household. A consumer unit can be a family, a financially independent person living alone or with others, or people living together who make joint spending decisions. There were about 136 million consumer units in 2024.
It is a real number, but narrower than it looks: an arithmetic mean rather than the budget of any particular household, describing a period that ended about twenty months ago and tracking what people spent - a different quantity from what things cost.
Original analysis - key findings
The underlying spending and price estimates on this page come from BLS. Our original analysis is the category-level crosswalk between CE spending and CPI-U annual-average indexes, together with the price-adjusted residual calculations below. The residuals are constructed statistics, not official BLS measures.
- Consumer-unit spending and the consumer price index, compared over the same two calendar years, one category at a time. Published sources report each separately; setting them side by side requires a crosswalk, and that crosswalk is ours. Download the CSV or read the method.
- Rented dwellings show the closest alignment in the crosswalk - spending +5.4 percent against a rent index +5.1 percent, three tenths of a point apart.
- Auto insurance shows a large negative residual. Its index rose 17.8 percent while spending on it rose 12.3 percent. The largest negative residual in the comparable rows belongs to cereals and bakery products, at -6.6 percent.
- Total expenditures rose 1.8 percent, and that change was not statistically significant at the 95 percent level. Among the fourteen major categories, housing alone had a statistically significant increase.
- Two large-looking point estimates did not clear that bar either: spending on drugs rose 11.3 percent and spending on groceries at home rose 2.8 percent, but neither change carries an asterisk in CE table A.
Each is sourced below, and each carries its limits with it.
Average monthly expenses by category
BLS tracks spending through the Consumer Expenditure Surveys (CE). The latest annual release covers 2024 and was published on December 19, 2025. CE reports annual totals; the monthly column divides each by twelve.
| Category | Monthly expenses | Per year | Share |
|---|---|---|---|
| Housing | $2,189 | $26,266 | 33.4% |
| Transportation | $1,110 | $13,318 | 17.0% |
| Food | $847 | $10,169 | 12.9% |
| - groceries eaten at home | $519 | $6,224 | 7.9% |
| - eating out | $329 | $3,945 | 5.0% |
| Personal insurance and pensions | $816 | $9,797 | 12.5% |
| Healthcare | $516 | $6,197 | 7.9% |
| Entertainment | $301 | $3,609 | 4.6% |
| Cash contributions | $191 | $2,292 | 2.9% |
| Apparel and services | $167 | $2,001 | 2.5% |
| Education | $131 | $1,569 | 2.0% |
| Miscellaneous | $102 | $1,218 | 1.6% |
| Personal care | $82 | $978 | 1.2% |
| Alcoholic beverages | $54 | $643 | 0.8% |
| Tobacco products | $29 | $352 | 0.4% |
| Reading | $10 | $125 | 0.2% |
| All categories | $6,545 | $78,535 | 100% |
Source: CE 2024, tables A and B. Groceries eaten at home and eating out are components of Food and should not be added again when totaling the table. Monthly figures may also differ slightly because of rounding. BLS also breaks expenses down by consumer-unit size, age and region - those figures differ sharply from this national line.
A note on the $6,545 figure: BLS "expenditures" are not the same thing as a household's monthly cash outflow. Mortgage principal is excluded, while categories such as pension contributions, Social Security deductions and cash contributions are included. Vehicle purchases are also treated differently under expenditures and outlays. BLS says total outlays better reflect the information a typical consumer unit would use for regular budget planning. The $6,545 figure is best used as a national spending benchmark, not a model household budget.
Housing takes a third of the total on its own; add transportation and the two take half. The CE housing category is broader than the CPI Shelter index - it also includes utilities, household operations and furnishings. Six categories commonly targeted by budgeting advice - apparel and services, entertainment, personal care, alcohol, tobacco and reading - come to 9.7 percent combined. Whether all six are genuinely optional is a judgement call the figures do not settle.
Dividing an annual mean by twelve also smooths irregular and seasonal expenses into an artificial monthly average: winter heating, an auto policy renewed once or twice a year, or tuition due in the fall. Use the monthly mean as a benchmark, not as a household budget template.
Why the national average hides a wide spending range
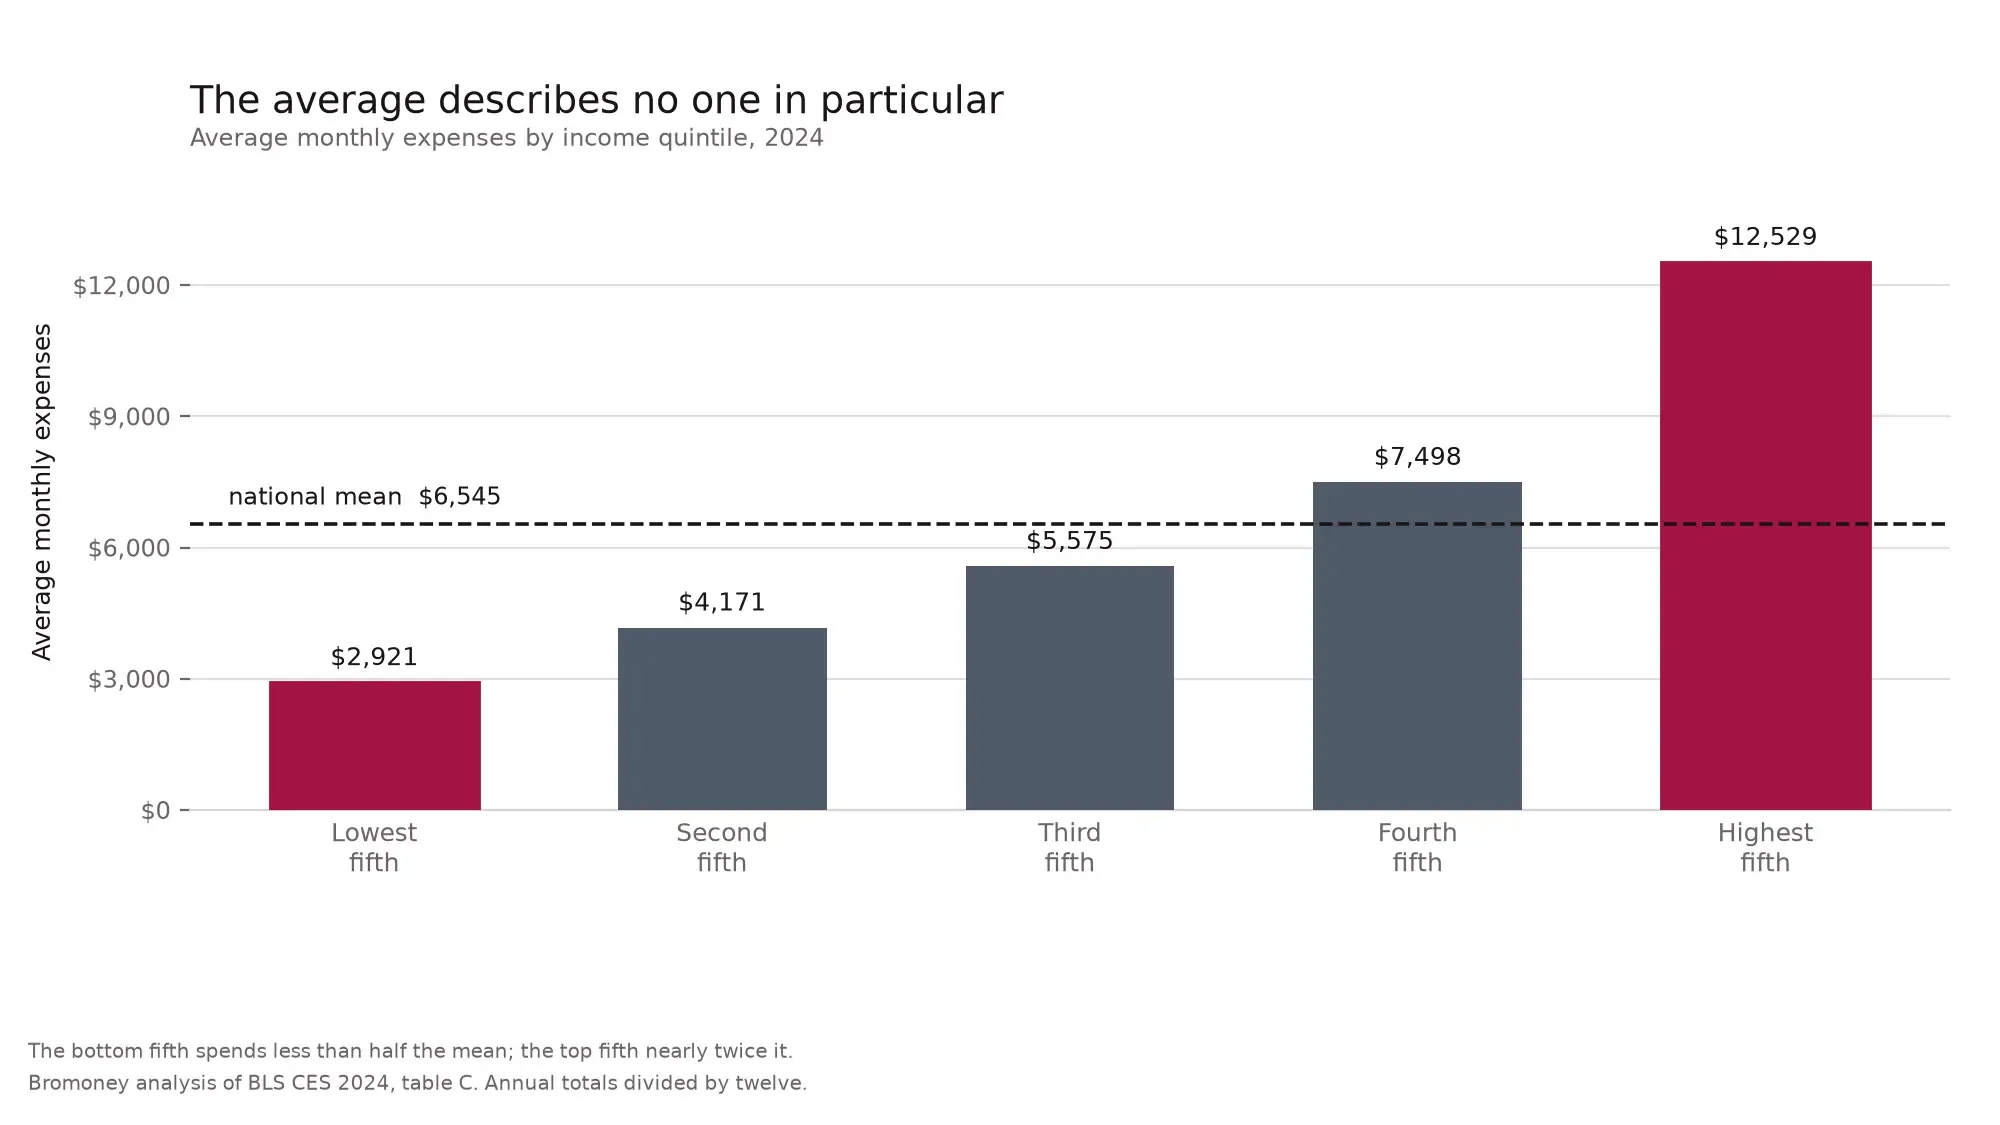
Every dollar figure above is a mean. Ranked by income before taxes, the spread is wide:
| Income quintile | Monthly expenses | Per year |
|---|---|---|
| Lowest fifth | $2,921 | $35,046 |
| Second fifth | $4,171 | $50,054 |
| Third fifth | $5,575 | $66,900 |
| Fourth fifth | $7,498 | $89,972 |
| Highest fifth | $12,529 | $150,342 |
Free to republish with attribution: Bromoney analysis of BLS data.
The lowest-income fifth spends less than half the national mean; the highest-income fifth spends nearly twice it. The $6,545 headline describes neither. A debt-to-income calculator runs on your own figures rather than a national mean.
Four official sources, very different reporting lags
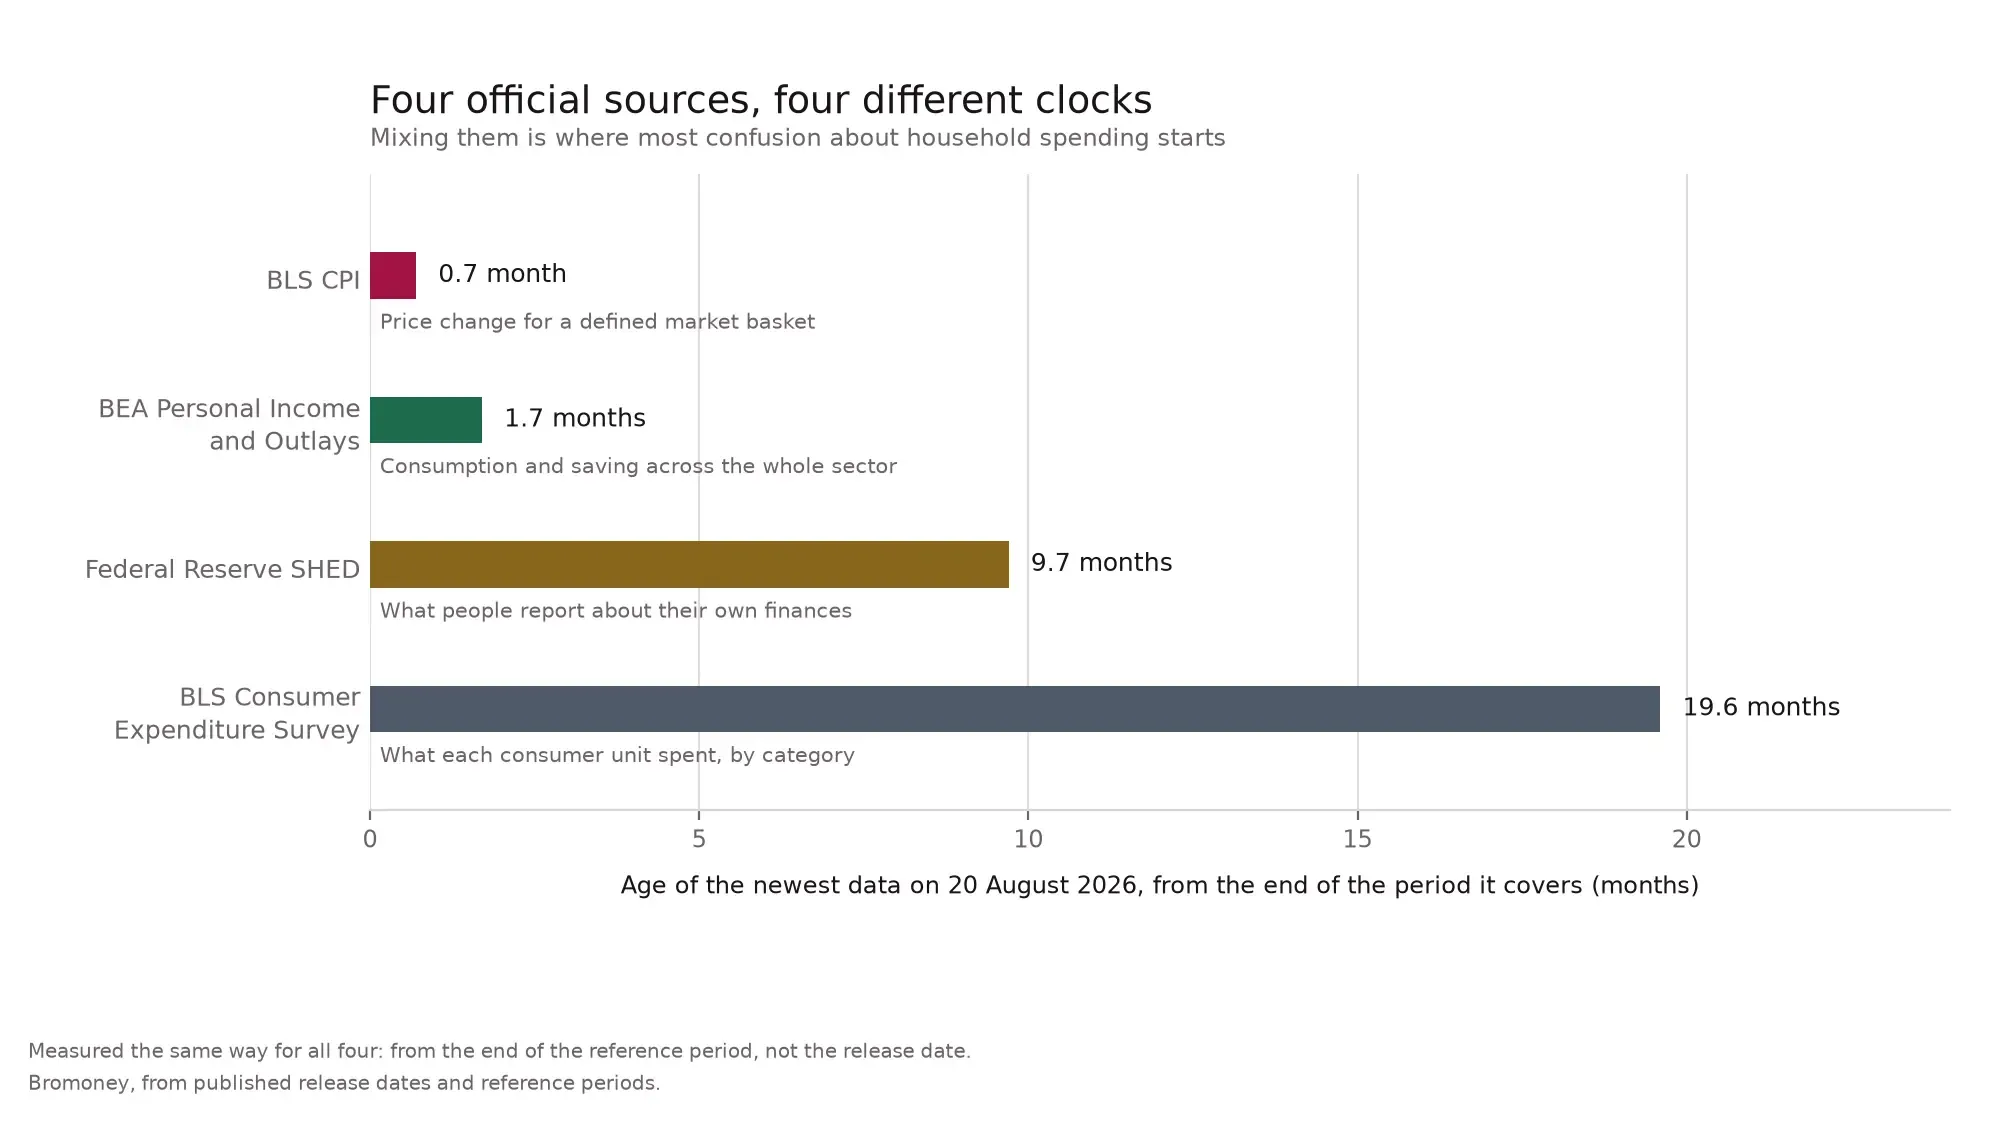
Confusion about monthly expenses comes from mixing sources that answer different questions on different schedules.
| Source | What it measures | Newest data period | Age of the data |
|---|---|---|---|
| BLS, CPI | Price change for a defined market basket | July 2026 | About four weeks |
| BEA, Personal Income and Outlays | Consumption and saving across the household sector | July 2026 | About four weeks |
| Federal Reserve, SHED | What people report about their own finances | 2025 survey | About ten months |
| BLS, CE | What each consumer unit spends, by category | 2024 | About twenty months |
Age is measured from the end of the period covered to August 28, 2026. CPI and BEA now both have July 2026 data, but their release schedules and the questions they answer are different. A release date and the age of the underlying data are not the same thing.
That last row matters most. The most detailed federal spending record here describes a period that ended about twenty months ago. Any sentence of the form "Americans now spend X on Y" citing CE 2024 overstates how current the evidence is.
Which spending changes were statistically significant
CE flags movement it can detect: an asterisk means the dollar difference passed a t-test at the 95 percent level. A change without one does not mean there was no change; it means the estimated difference was not statistically distinguishable from zero at that level. Between 2023 and 2024, among the lines published in CE table A, nine changes cleared that bar.
| Category | 2023 to 2024 | Change |
|---|---|---|
| Meats, poultry, fish and eggs | $1,164 to $1,414 | +21.5% |
| Vehicle insurance | $1,775 to $1,993 | +12.3% |
| Other vehicle expenses | $3,845 to $4,206 | +9.4% |
| Owned dwellings | $8,699 to $9,310 | +7.0% |
| Rented dwellings | $5,370 to $5,660 | +5.4% |
| Dairy products | $602 to $631 | +4.8% |
| Housing (whole component) | $25,436 to $26,266 | +3.3% |
| Social Security deductions | $6,508 to $6,684 | +2.7% |
| Cereals and bakery products | $830 to $779 | -6.1% |
The eight statistically significant increases were concentrated in housing, vehicle expenses, food subcategories and Social Security deductions. That pattern does not by itself classify any category as essential or discretionary.
Now the part that reframes the headline. Total expenditures rose 1.8 percent, but that change was not statistically significant at the 95 percent level. Income before taxes rose 2.4 percent, also without a statistically significant change. Among the fourteen major expenditure categories, housing was the only one with a statistically significant increase. Apparel fell 2.0 percent and entertainment 0.7 percent, but neither decrease was statistically significant. Spending on drugs rose 11.3 percent, also without an asterisk.
Spending is not the same as cost
CE records expenditure estimates. CPI tracks price changes for a defined market basket. Spending can rise because an item got more expensive, because people bought more, because they traded up, or because the mix of consumer units making the purchase changed.
Comparing the two fairly requires the same period and reasonably comparable categories. Below, CE spending for 2023-2024 sits against CPI-U calendar-year annual averages for those same two years, using BLS API period M13. The residual is arithmetic, not a separate measurement: spending change deflated by the corresponding index change. A positive residual means the spending estimate grew faster than the index; a negative one means it grew more slowly. It does not measure quantity. Family composition, purchase incidence, trading up or down, the number of cars or tenants, sample geography and the differing category weights of the two systems all feed into it, and these aggregate series cannot separate them.
| CE category | Spending | CPI-U annual-average change, 2023-2024 | Price-adjusted residual | Match |
|---|---|---|---|---|
| Meats, poultry, fish and eggs | +21.5% * | +2.2% (CUUR0000SAF112) | +18.9% | closest match |
| Drugs | +11.3% | +1.4% (CUUR0000SEMF01) | +9.8% | partial match - CE and CPI category coverage is not identical |
| Dairy products | +4.8% * | -0.2% (CUUR0000SEFJ) | +5.1% | closest match |
| Gasoline | -1.6% | -5.1% (CUUR0000SETB01) | +3.7% | closest match |
| Groceries at home | +2.8% | +1.2% (CUUR0000SAF11) | +1.6% | closest match |
| Owned dwellings | +7.0% * | OER +5.5% (CUUR0000SEHC) | n/a | not comparable - different concepts |
| Rented dwellings | +5.4% * | +5.1% (CUUR0000SEHA) | +0.3% | closest match |
| Apparel and services | -2.0% | +0.7% (CUUR0000SAA) | -2.7% | partial match - CE includes services |
| Food away from home | +0.3% | +4.1% (CUUR0000SEFV) | -3.6% | closest match |
| Vehicle insurance | +12.3% * | +17.8% (CUUR0000SETE) | -4.6% | closest match |
| Cereals and bakery products | -6.1% * | +0.5% (CUUR0000SAF111) | -6.6% | closest match |
* = the CE spending change passed the 95 percent test. Index levels, series IDs and workings are in the downloadable CSV.
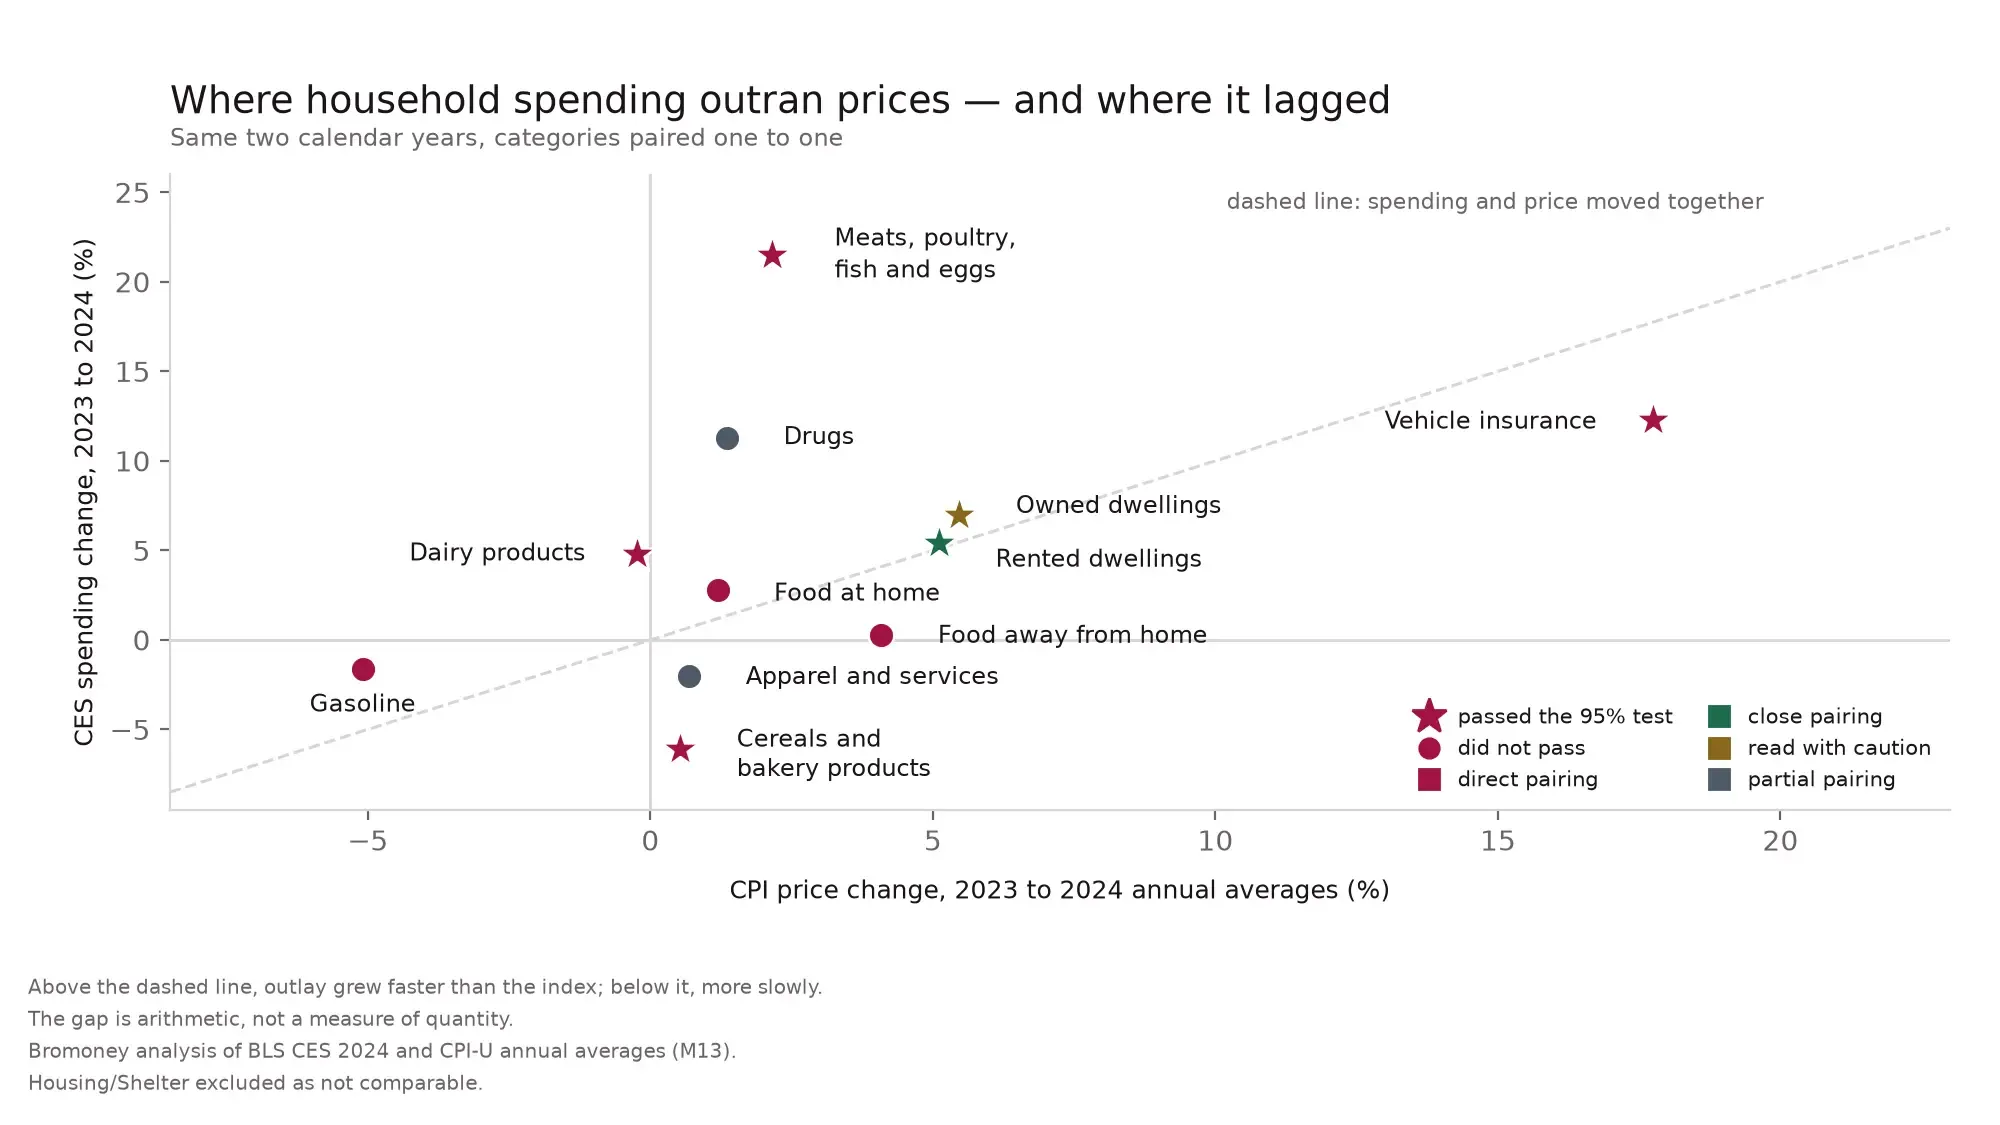
Spending change against price change over the same two calendar years. Stars mark CE changes that passed the 95 percent test. Owned dwellings is shown for context but excluded from residual interpretation because the CE and CPI concepts differ. Free to republish with attribution: Bromoney analysis of BLS data.
Rented dwellings show the closest alignment. Spending rose 5.4 percent while the CPI-U index for rent of primary residence rose 5.1 percent - three tenths of a point apart over the same calendar years. This is the closest available pairing in the crosswalk, although the definitions are not identical. The alignment is consistent with rent price growth being an important contributor to the increase in reported rental spending. These aggregate series cannot estimate how much of the spending increase was caused by prices rather than changes in tenants, locations or dwelling mix.
Auto insurance moved the other way. Its CPI-U index rose 17.8 percent while CE spending rose 12.3 percent - a residual of about -4.6 percent, the largest negative gap among the comparable vehicle rows. The gap could reflect changes in coverage, deductibles, vehicles, carriers or who was insured at all, but these series cannot identify which factor moved or by how much. The residual is a reason to ask what changed in response to higher prices, not an answer to that question.
Eating out produced a negative residual too. The food-away-from-home index rose 4.1 percent while spending rose 0.3 percent, leaving a residual near -3.6 percent. The gap could be consistent with lower quantities purchased, trading down, or changes in the mix of consumers and restaurants. The residual itself is not a quantity measure, the underlying 0.3 percent spending change did not clear the 95 percent bar, and the residual carries no confidence interval.
Two cautions. The +18.9 percent residual for meats, poultry, fish and eggs should not be interpreted as an 18.9 percent increase in the quantity purchased. It is not a quantity index and also absorbs changes in product mix, purchase incidence, reporting and sample composition. The same interpretive limit applies to the drugs row, whose underlying CE spending change was not statistically significant.
Owned dwellings require a different treatment. CE owned-dwelling expenditures include costs such as mortgage interest, property taxes, insurance, maintenance and repairs. CPI owners' equivalent rent estimates the rental value of owner-occupied housing instead. Because those concepts differ fundamentally, the OER change is shown only as context and no residual is calculated or interpreted.
One aggregate category is deliberately absent from the crosswalk. CE Housing rose 3.3 percent, and it is tempting to set that against CPI Shelter - but the CE line also includes utilities, household operations and furnishings, which Shelter does not. That pairing is therefore not used for a conclusion.
Where the index stands now
The comparison stops at 2024 because that is where the published annual CE spending record stops. CPI-U has moved since; those readings stand alone and are not evidence about spending.
Over the twelve months to July 2026, CPI-U rose 3.4 percent overall and 2.5 percent excluding food and energy. Over the same twelve months, energy rose 14.7 percent, gasoline 24.6 percent, airline fares 25.5 percent, apparel 3.9 percent, shelter 3.2 percent and groceries 2.7 percent. The CPI-U index for motor vehicle insurance, which had risen sharply between the 2023 and 2024 annual averages, fell 0.3 percent month over month in July 2026. Whether consumers absorbed those price changes, substituted or cut back is not yet knowable from CE. BLS plans to release the 2025 annual CE spending data on October 29, 2026.
What people did about it
The Federal Reserve's SHED survey asks people directly what they did as the cost of living rose. The 2025 wave ran October 17-28, 2025.
| Response to higher prices | 2025 | Change since 2022 |
|---|---|---|
| Switched to cheaper products | 62% | -1 |
| Used less or stopped using products | 60% | -7 |
| Delayed a major purchase | 46% | -4 |
| Reduced saving | 41% | -10 |
| Worked more or took another job | 17% | -1 |
| Increased borrowing | 16% | +1 |
| Asked for a raise | 7% | -1 |
| Took any of these actions | 77% | -5 |
Respondents could select more than one response, so the column does not sum to 100.
Two responses dominate and sit close together: trading down to less expensive products (62 percent) and using less or stopping (60 percent). Both were widespread; the survey does not rank one over the other, and it does not ask whether the original purchase was careless or impulsive. It records what people changed, not why they had been spending.
The decline in "reduced saving" is harder to interpret: the share fell from 51 percent in 2022 to 41 percent in 2025. At least two explanations are compatible with the decline - fewer people may have had savings available to draw on, or fewer may have needed to reduce saving. SHED cannot distinguish between them. The Federal Reserve's own summary notes that saving and credit measures held broadly steady while the share saying higher prices had worsened their financial situation declined. One line stands out: 16 percent reported borrowing more, the only listed response nominally higher than in 2022, though the one-point change is not tested for significance in this table.
Other measures: 63 percent could cover a $400 emergency expense with cash or its equivalent, unchanged for four years and down from 68 percent in 2021. And 23 percent of tenants were behind on rent at some point, up from 21 percent in 2024 and 17 percent in 2021.
There is also a shift no spending survey counts as a financial decision: 49 percent of adults under 30 lived with a parent in 2025, up twelve points from 2019. Sharing a roof can lower what a young adult pays, though the survey records the living arrangement rather than who pays what.
Where borrowing is already part of how the month balances, a debt payoff calculator works from your own balances, rates and repayments.
What these figures cannot tell you
Each limit below is documented by the agency itself.
After-tax income is no longer published in the CE tables. BLS says the National Bureau of Economic Research has not updated the TAXSIM model it used for tax-liability estimates beyond the 2023 tax year. BLS therefore could not produce federal tax, state tax or after-tax income estimates for the 2024 CE data and says it will no longer publish those estimates in CE tables, the LABSTAT database or public-use microdata. Any 2024 claim about the share of "their income" going to housing that relies on the published CE income figure is therefore using income before taxes - a different denominator.
The housing and medical questions changed in 2024. BLS implemented another phase of its streamlined Interview Survey questionnaire during the 2024 collection cycle, with changes focused mainly on housing and medical expenditures, including rented and owned property, utilities and medical expenses. Housing is also the one major category with a statistically significant increase in 2024. BLS does not claim the redesign caused that increase, and neither do we - but the two coincided. For perspective, BLS found that among consumer units answering both versions of its health-insurance questions in 2014, mean reported expenditure was 26.2 percent higher under the new questions. That illustrates how questionnaire design can materially affect reported spending levels.
High-variance estimates are now published rather than withheld. Beginning with the 2024 publication tables, BLS includes mean estimates with relative standard errors of 25 percent or more - a level the CE program considers unreliable - and flags them for caution instead of suppressing them as it did in the 2022 and 2023 publication tables.
The national CE tables cannot be used to infer state cost-of-living differences. BLS says this directly in its FAQ: CE reports actual expenditure levels, which can vary across areas because of age, income, consumer-unit size, tastes and other differences; it does not price a standard bundle of goods and services. For comparisons of relative price levels across states, BEA Regional Price Parities are the more appropriate source.
Expenditures are not cash outlays. Mortgage principal is excluded from expenditures even though it leaves a homeowner's account; BLS classifies it under outlays. Vehicle financing is treated differently too. This is why the $2,189 monthly housing expenditure should not be read as the full monthly cash cost of homeownership.
The full size of nonsampling error is unknown. BLS says nonsampling error can come from question interpretation, respondent recall, recording or coding mistakes and other collection and processing problems, and that "the full extent of nonsampling error is unknown." That is another reason not to over-interpret small decimal differences as economically meaningful.
A short glossary
| Term | What it means | Where it misleads |
|---|---|---|
| Consumer unit | A family, financially independent individual, or people living together who jointly make major spending decisions | Similar to, but not identical with, a Census household |
| Mean vs median | CE figures cited here are arithmetic means | A mean can be pulled upward by high-spending units and does not represent the spending of a typical individual household |
| Outlay vs expenditure | An outlay includes mortgage principal and treats financed vehicle purchases differently | Published CE tables use the narrower expenditure approach |
| The asterisk | Marks a dollar difference that passed a t-test at 95% | Its absence means the survey cannot distinguish the estimated change from zero at that level - not that the change was necessarily small |
| Price-adjusted residual | Spending change deflated by a corresponding CPI-U index change | Arithmetic, not measurement: not a quantity index, not tested for significance, and it absorbs changes in who bought at all |
| Personal saving rate | Saving as a share of disposable personal income - 3.0% in July 2026 | A sector-wide aggregate, not what any particular person sets aside |
Sources, methodology and data
| Source | Used for | Latest release | Next |
|---|---|---|---|
| BLS CE 2024 (frozen archive) | Category spending, significance, quintiles | December 19, 2025 | October 29, 2026 |
| BLS CPI, July 2026 (frozen archive) | Twelve-month CPI-U changes | August 12, 2026 | September 11, 2026 |
| BLS public API | CPI-U calendar-year annual averages, 2023 and 2024 | live | - |
| BEA Personal Income and Outlays, July 2026 | Consumption and the saving rate | August 26, 2026 | September 30, 2026 |
| Federal Reserve SHED 2025 | Reported behaviour, hardship, rent arrears | May 2026 | Spring 2027 |
Methodology. Spending comes from CE table A as published, unadjusted; monthly figures are the annual total divided by twelve. CPI-U index levels are calendar-year annual averages for 2023 and 2024 from BLS API period M13, U.S. city average, not seasonally adjusted. Series IDs are shown in the crosswalk above and should also be retained in the downloadable data. For comparable rows, the residual is (1 + spending change) / (1 + index change) - 1, per consumer unit. It is a deflation, not an identification: it does not measure quantity, carries no confidence interval, and absorbs shifts in consumer-unit composition, purchase incidence, product mix, sample geography and the differing category weights of the two systems. Significance is BLS's own, at 95 percent, tested on dollar differences. Where definitions are not sufficiently comparable - notably owned dwellings versus owners' equivalent rent - no residual is calculated or interpreted.
Workings: bromoney_ces_cpi_crosswalk_2023-2024.csv. Checked against source releases on August 28, 2026. Tables may be republished with attribution: Bromoney analysis of BLS, BEA and Federal Reserve data.
Frequently asked questions
What are average household expenses in the United States?
The average BLS consumer unit spent $6,545 a month, or $78,535 across 2024 - the most recent annual CE period BLS has published. Housing accounted for 33.4 percent, transportation 17.0 percent and food 12.9 percent. A consumer unit is similar to, but not identical with, a Census household.
What is average monthly spending per US household?
About $6,545 when the 2024 annual mean per consumer unit is divided by twelve. It is an arithmetic mean across consumer units of every size, including one-person units, so it describes no particular family. Actual expenses also vary across the calendar, which makes the figure a reference point rather than a budget.
Which spending categories rose the most in the latest Consumer Expenditure release?
Between 2023 and 2024, average spending on meats, poultry, fish and eggs rose 21.5 percent, vehicle insurance 12.3 percent and other vehicle expenses 9.4 percent. All three changes were statistically significant in the BLS CE tables. Among the fourteen major expenditure categories, housing was the only one with a statistically significant increase.
Why do average monthly expenses differ from inflation figures?
They measure different things. CE records what people spent; CPI-U tracks price changes for a defined market basket. Over the same 2023-2024 calendar years, spending on rent rose at a rate close to the rent index, while spending on vehicle insurance rose more slowly than the motor vehicle insurance price index. Neither comparison by itself measures how much people bought.
How current is this spending record?
It covers calendar 2024 and was released in December 2025. CPI-U is much more current: the July 2026 CPI release came out on August 12, 2026. BLS plans to publish the 2025 annual CE spending data on October 29, 2026.
Reproducibility package. The complete GitHub repository contains the downloadable crosswalk, calculation scripts, frozen BLS API response, claim-level evidence ledger, source manifest, and reusable SVG and PNG charts. The crosswalk and charts can be rebuilt from the committed inputs.

Denis Goncharenko
Head of Content
Editorial Policy: no secondary statistics. Every claim is linked to an official source and dated — datasets and methods are open for review.

Was this article helpful?
Same blogs
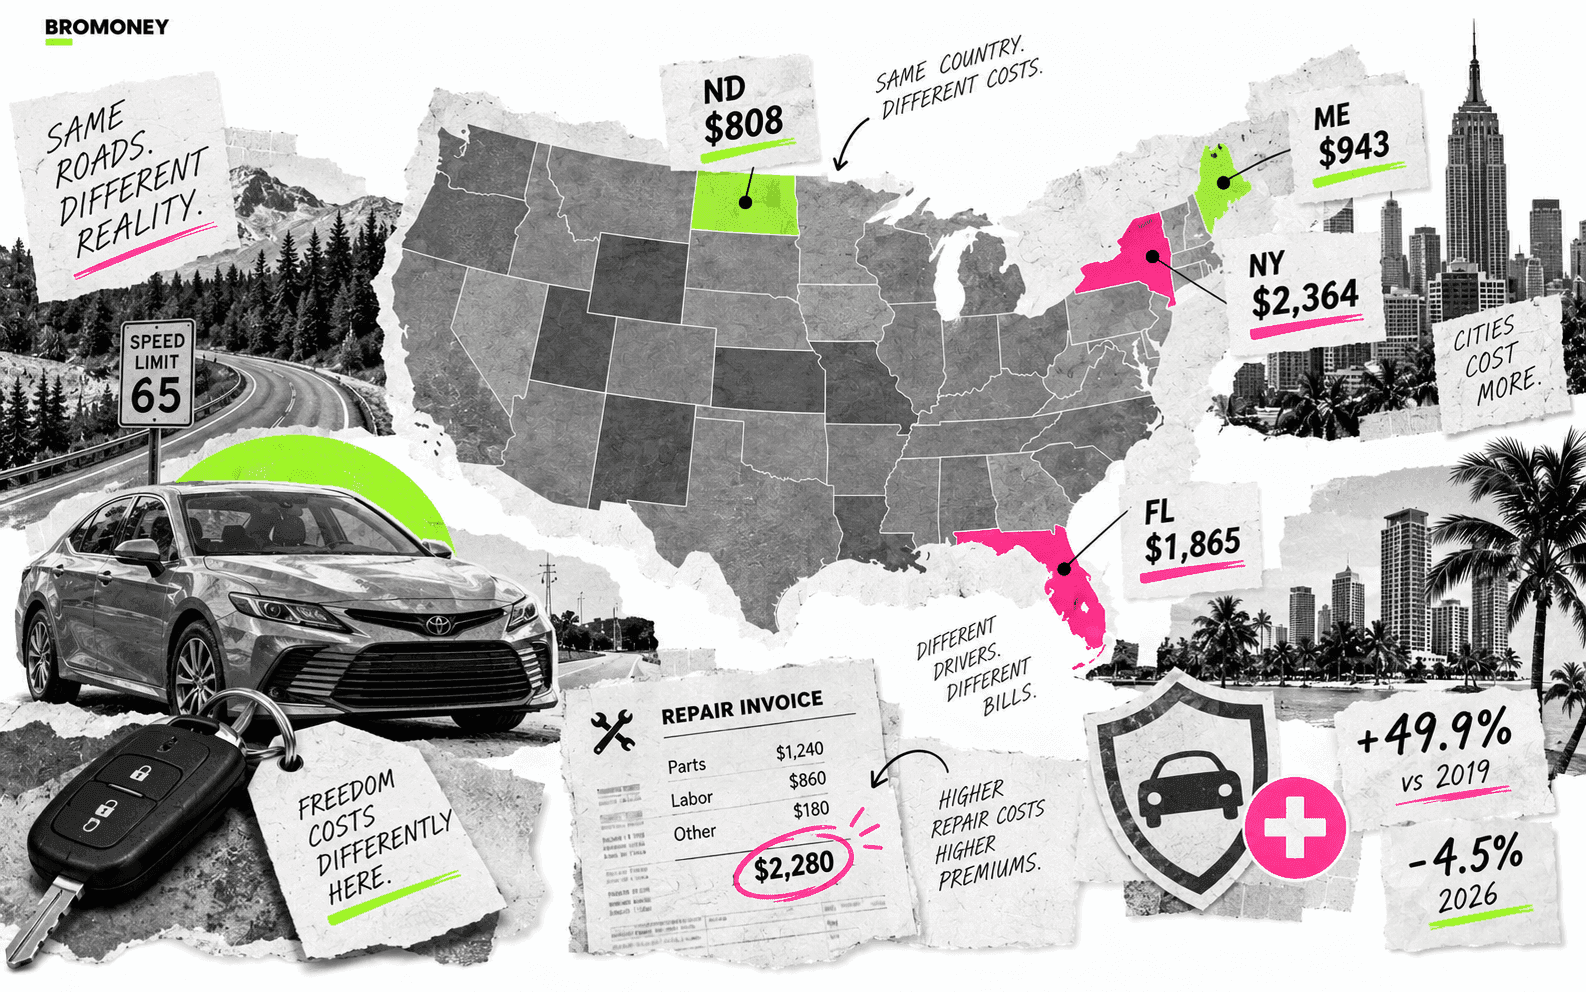
Why Car Insurance Went Up and What Actually Moves the Premium
Car insurance spending rose 12.3 percent in 2024, one of only two costs BLS called statistically significant. NAIC's 2023 state averages, why rates are falling even as the level sits 49.9 percent above 2019, what actually drives claims costs, and which levers on your policy are worth checking.
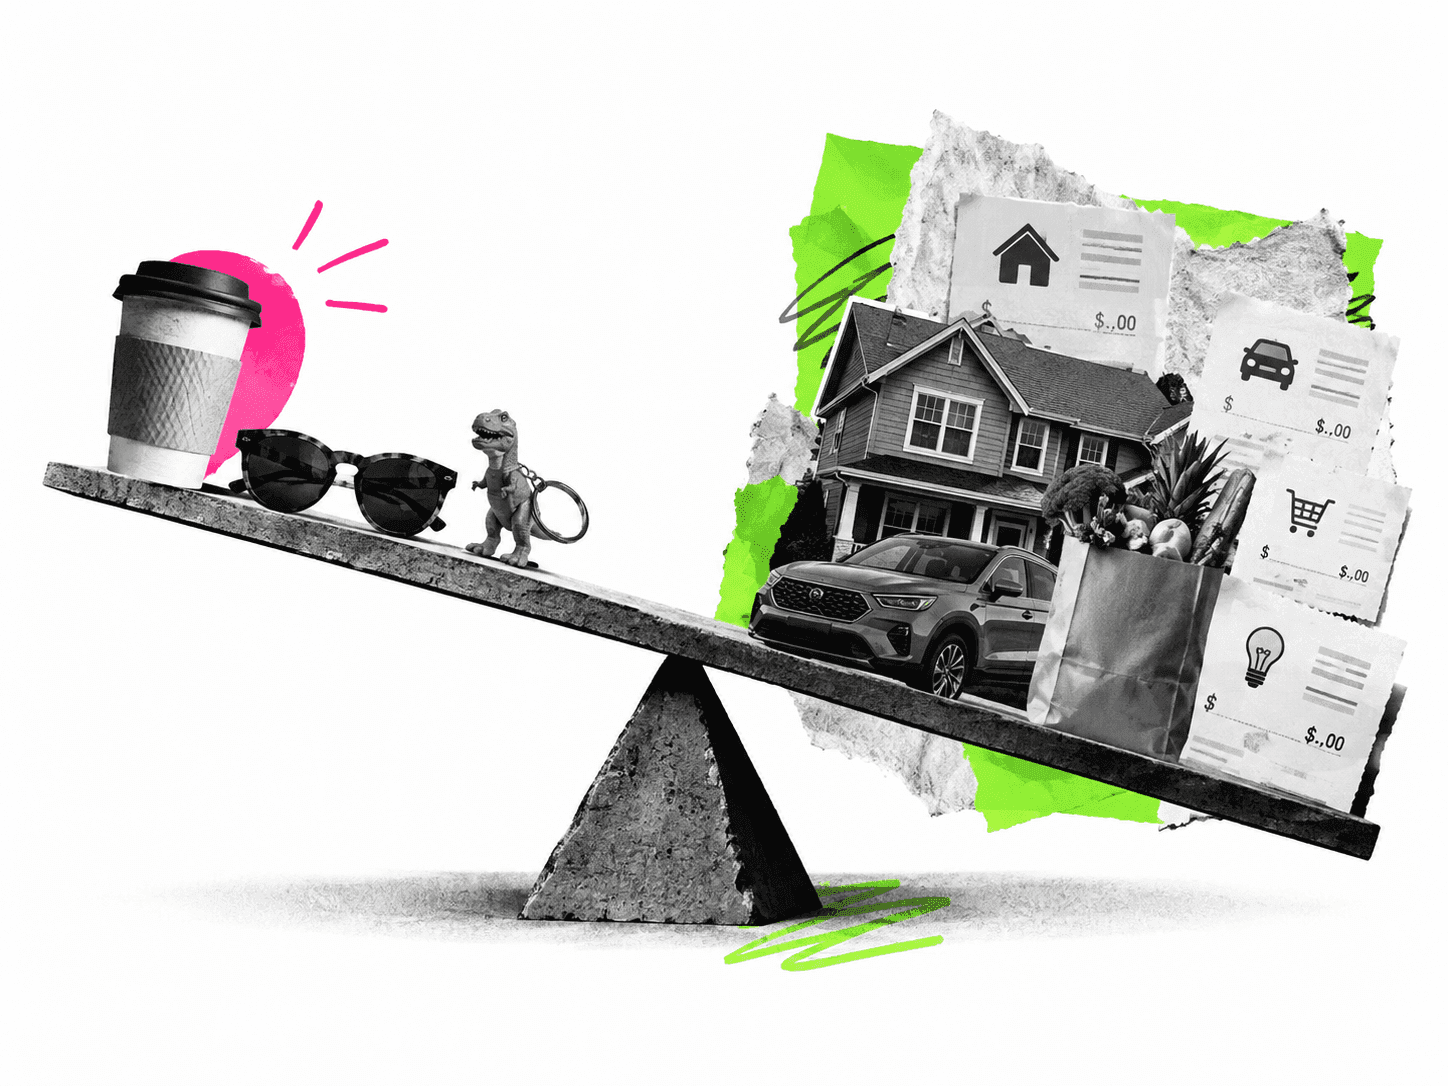
Stop Blaming the Latte: Impulse Buying Isn't the Whole Budget Story
BLS data shows apparel and entertainment spending barely moved in 2024, while car insurance, housing and groceries rose - some by double digits. Why the numbers behind the top impulse-buying articles don't hold up, and a review method that starts with the bills, not the coffee.
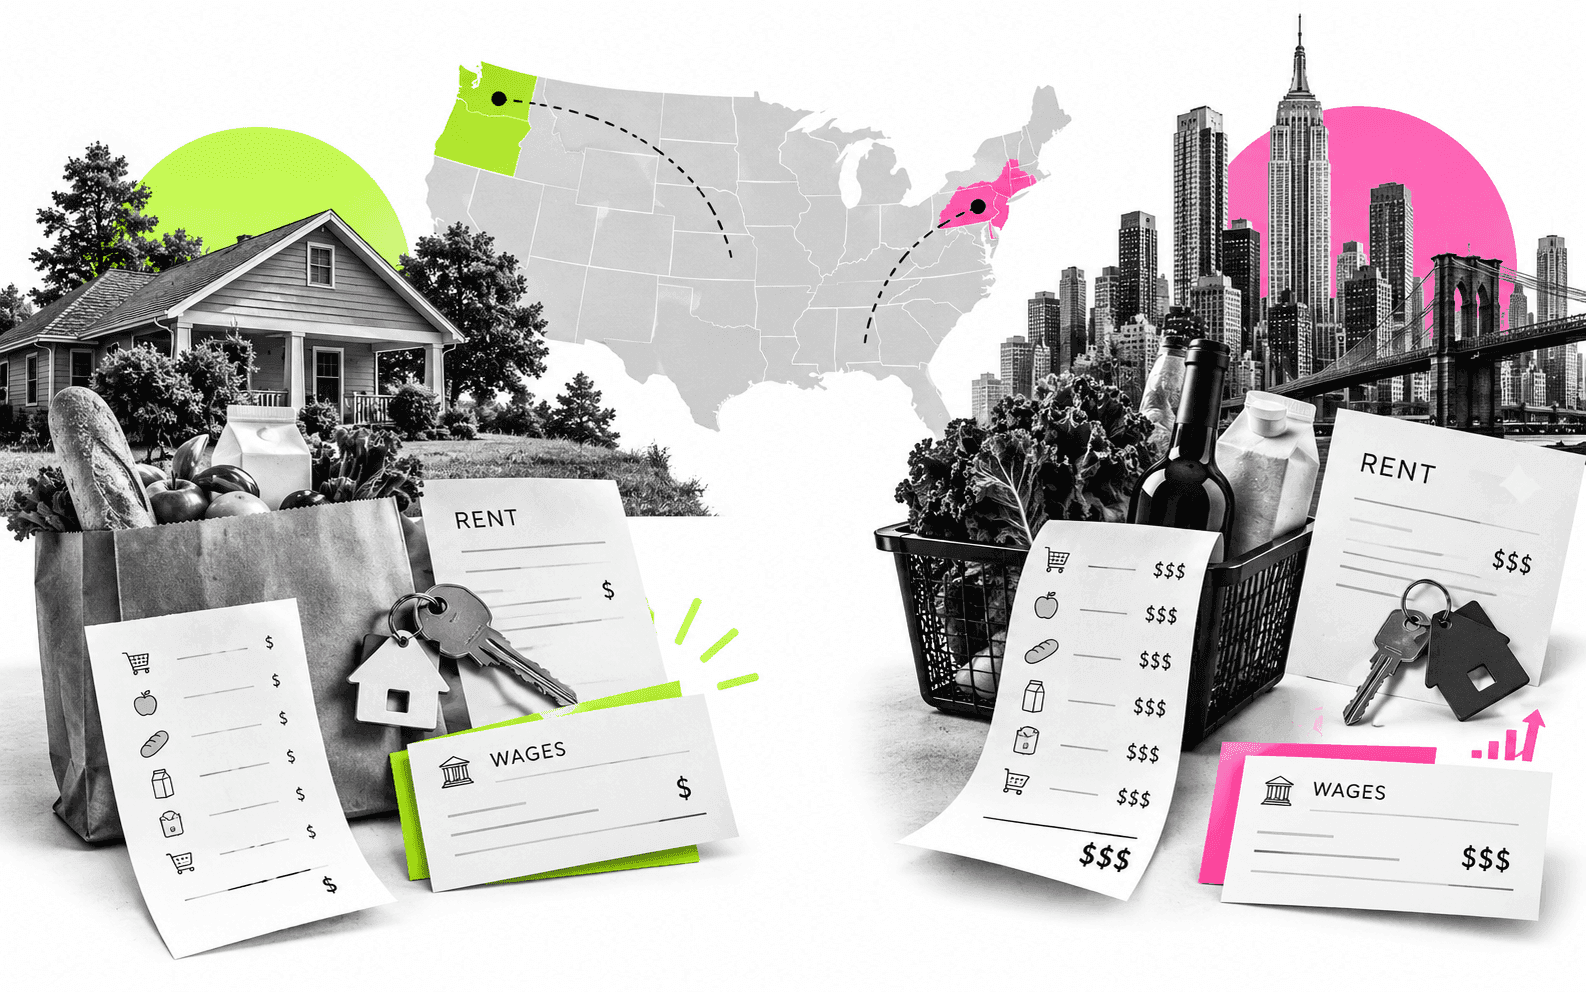
Cost of Living by State: Prices, Rent and Wages
A 51-row table built from U.S. federal series (BEA, Census, HUD, EIA, DOL), not the private volunteer survey most rankings use. Housing costs vary six times more than goods across states, cheap states aren't always affordable, and minimum wage sits below a modelled living wage everywhere checked.