

Why Car Insurance Went Up and What Actually Moves the Premium
Why Car Insurance Went Up and What Actually Moves the Premium
Most household costs rose a little in 2024, and the increase was small enough that the Bureau of Labor Statistics could not call it real. Car insurance was the exception. Spending on it climbed 12.3 percent in a single year, and that change did clear the 95 percent bar.
So the bill you opened was not your imagination. Whether your own renewal moved for the same reasons is a separate question, and national figures cannot answer it.
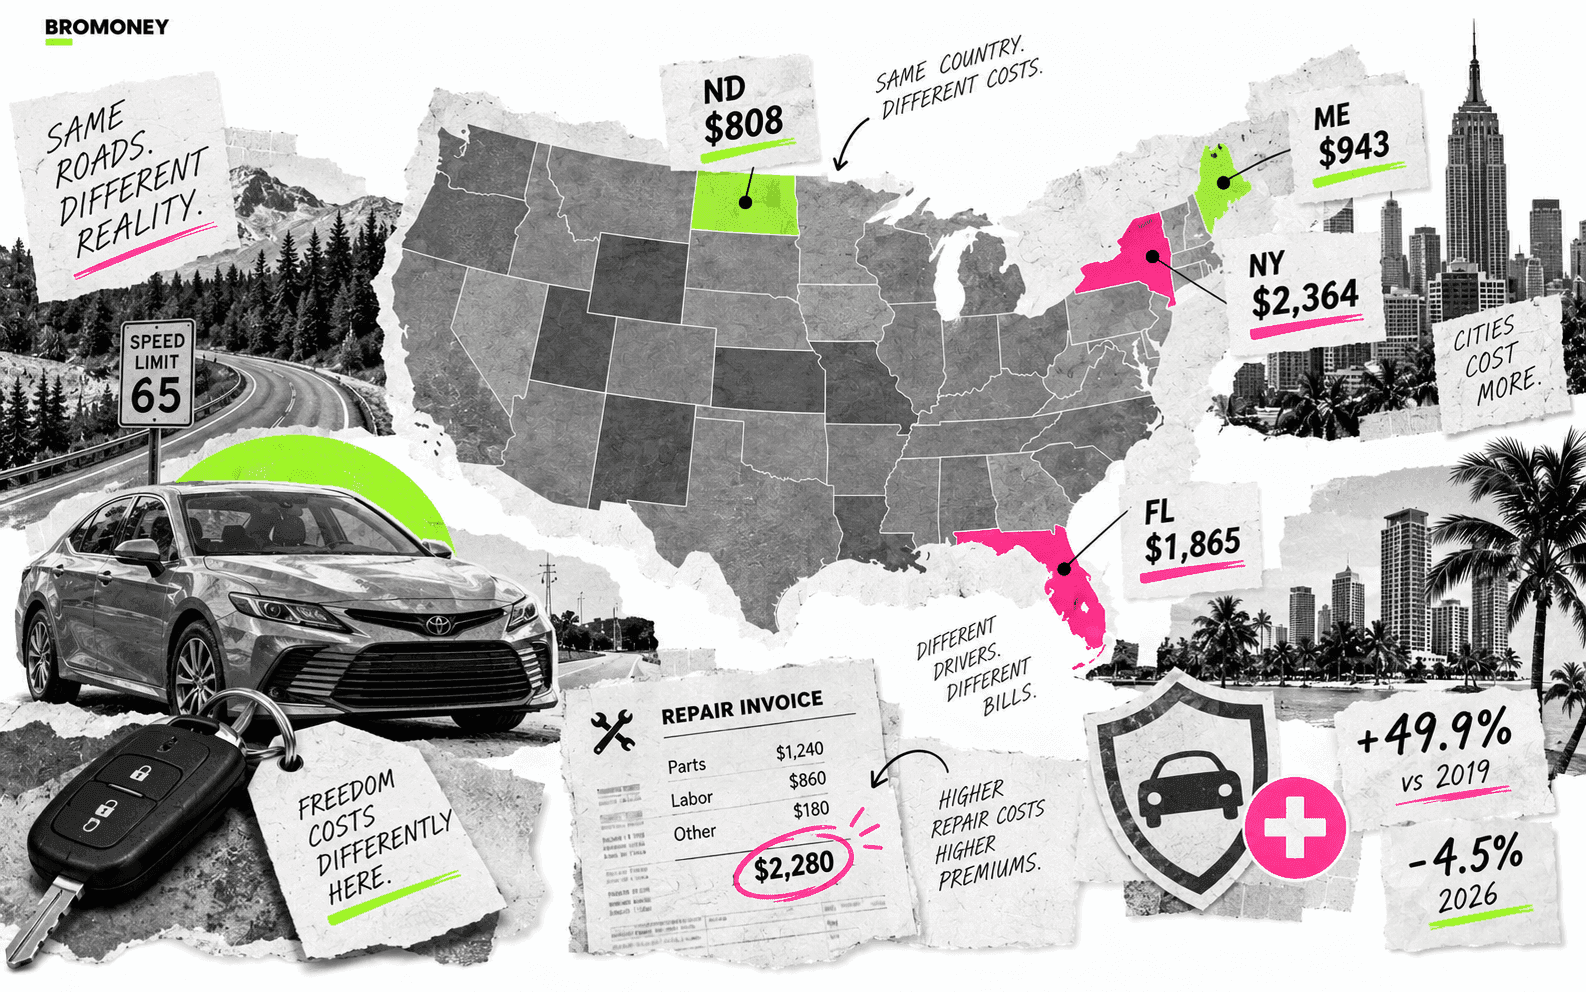
Here is the part that complicates the story: car insurance rates are currently falling. The BLS index for motor vehicle insurance is down 4.5 percent over the twelve months to July 2026. Pages that tell you car insurance rates are rising right now are describing 2023.
Both things are true, because they measure different things. The rate of increase has stopped. The level it climbed to has not come back down - the index still sits 49.9 percent above where it averaged in 2019. That gap is what your monthly payment is made of.
What "average car insurance by state" actually measures
The state-by-state figures on this page come from the National Association of Insurance Commissioners (NAIC), which collects them from statistical agents rather than from a quote form. The most recent edition is the 2022/2023 Auto Insurance Database Report, adopted December 2025, and its newest data year is 2023.
That lag matters, and no page should print these numbers without it.
NAIC's headline measure is average expenditure per insured vehicle: the total written premium for liability, collision and comprehensive coverage, divided by liability written car-years. In 2023 the countrywide average car insurance expenditure was $1,281.92, up 13.99 percent from $1,124.57 the year before.
Read the denominator again, because it decides what the number means. It is per insured vehicle, not per household and not per policy. A household with three cars appears three times. And because the divisor counts vehicles carrying liability coverage - which may or may not carry physical damage coverage - the figure is not the cost of a full coverage car insurance policy either.
It is an estimate of what consumers in a state spent on average. It is not a quote, and nobody is charged it.
Average car insurance by state: the 2023 NAIC table
Average car insurance rates by state are usually quoted from this table: average expenditure per insured vehicle, all 50 states and the District of Columbia, with the one-year and four-year change alongside.
| State | 2023 average | vs 2022 | vs 2019 |
|---|---|---|---|
| Alabama | $1,081 | +11.9% | +16.6% |
| Alaska | $1,113 | +9.8% | +12.3% |
| Arizona | $1,344 | +16.4% | +26.2% |
| Arkansas | $1,051 | +13.4% | +16.7% |
| California | $1,225 | +12.7% | +16.5% |
| Colorado | $1,453 | +14.0% | +23.6% |
| Connecticut | $1,394 | +9.0% | +10.0% |
| Delaware | $1,462 | +12.8% | +13.6% |
| District of Columbia | $1,677 | +11.7% | +16.5% |
| Florida | $1,865 | +18.9% | +25.2% |
| Georgia | $1,555 | +15.6% | +23.0% |
| Hawaii | $888 | +5.2% | +5.8% |
| Idaho | $864 | +11.9% | +16.8% |
| Illinois | $1,153 | +16.0% | +22.6% |
| Indiana | $926 | +13.8% | +18.7% |
| Iowa | $873 | +12.4% | +23.2% |
| Kansas | $973 | +12.0% | +18.9% |
| Kentucky | $1,046 | +11.5% | +10.4% |
| Louisiana | $1,754 | +12.6% | +12.4% |
| Maine | $856 | +11.7% | +22.9% |
| Maryland | $1,477 | +15.3% | +19.9% |
| Massachusetts | $1,326 | +11.4% | +12.2% |
| Michigan | $1,444 | +7.8% | -3.6% |
| Minnesota | $1,103 | +14.7% | +23.7% |
| Mississippi | $1,200 | +13.1% | +22.7% |
| Missouri | $1,155 | +15.1% | +23.7% |
| Montana | $975 | +10.2% | +16.6% |
| Nebraska | $981 | +12.5% | +21.5% |
| Nevada | $1,462 | +13.2% | +13.1% |
| New Hampshire | $987 | +12.0% | +14.1% |
| New Jersey | $1,573 | +11.5% | +13.1% |
| New Mexico | $1,082 | +13.0% | +16.0% |
| New York | $1,753 | +13.2% | +21.2% |
| North Carolina | $925 | +10.2% | +22.7% |
| North Dakota | $808 | +10.8% | +14.8% |
| Ohio | $947 | +13.4% | +17.5% |
| Oklahoma | $1,084 | +13.1% | +18.6% |
| Oregon | $1,170 | +16.4% | +18.2% |
| Pennsylvania | $1,155 | +13.5% | +16.0% |
| Rhode Island | $1,540 | +8.2% | +11.4% |
| South Carolina | $1,367 | +13.5% | +22.6% |
| South Dakota | $937 | +13.8% | +25.7% |
| Tennessee | $1,050 | +13.6% | +21.4% |
| Texas | $1,429 | +15.9% | +24.9% |
| Utah | $1,169 | +14.1% | +22.5% |
| Vermont | $893 | +12.6% | +14.0% |
| Virginia | $1,114 | +17.3% | +29.8% |
| Washington | $1,152 | +9.9% | +7.9% |
| West Virginia | $1,063 | +11.6% | +13.2% |
| Wisconsin | $922 | +13.8% | +20.2% |
| Wyoming | $948 | +11.8% | +22.1% |
| Countrywide | $1,282 | +14.0% | +19.2% |
*Source: NAIC 2022/2023 Auto Insurance Database Report, Table 4, adopted December 2025. Data year 2023. Dollars rounded; percentage changes computed on the unrounded figures.
The most and least expensive states for car insurance
Florida sits at the top at $1,865, followed by Louisiana at $1,754, New York at $1,753, the District of Columbia at $1,677 and New Jersey at $1,573.
At the other end: North Dakota at $808, Maine at $856, Idaho at $864, Iowa at $873 and Hawaii at $888.
The distance between the top and the bottom of that list is 2.31 times - Florida against North Dakota. A gap that size sits at the level of states rather than policies: these are aggregates across all business written, and NAIC attributes state-to-state differences to state characteristics, which it lists.
One row runs the other way. Michigan is the only state where the 2023 average sits below its 2019 level, down 3.6 percent while the country rose 19.2 percent. NAIC lists rate and form filing laws among the things that shape state differences, but the report does not attribute any single state's movement to any single cause, and neither will we.
Why the average is not the middle
The countrywide figure is a mean, and it behaves like one.
Only 17 of the 51 jurisdictions sit above it. The median state - the one with twenty-five above and twenty-five below - is Virginia at $1,114, some $168 under the countrywide average car insurance figure.
A handful of large, expensive states pull the national number upward. So if you live in one of the thirty-four below the line and your bill looks nothing like $1,282, the average is not wrong and neither are you. It was never describing the typical state.
Why car insurance went up: the level, not the current direction
What car insurance rates did in 2026
The BLS consumer price index tracks car insurance rates separately from what households spend on insurance. Retrieved from the BLS public data API on August 26, 2026, that series shows:
| Series | Twelve months to July 2026 | July 2026 vs 2019 average |
|---|---|---|
| Motor vehicle insurance | -4.5% | +49.9% |
| Motor vehicle maintenance and repair | +6.6% | +55.5% |
| Motor vehicle parts and equipment | +1.5% | +28.9% |
| Used cars and trucks | -1.9% | +32.1% |
| New vehicles | +0.5% | +22.3% |
| All items | +3.4% | +30.6% |
Source: BLS public data API, CPI-U series CUUR0000SETE, SETD, SETC, SETA01, SETA02 and SA0, not seasonally adjusted, retrieved August 26, 2026. Monthly releases: Consumer Price Index.
Two readings of the same row, and both belong in your head at once. Car insurance rates are coming down this year. Car insurance rates are also half again what they were before 2020, which is more than all items combined managed over the same stretch.
Falling car insurance rates and a high car insurance bill are not a contradiction. A rate can decline from a level that was reset upward and still leave you paying more than you did in 2019.
What households actually spent
The Consumer Expenditure Survey measures the other side - dollars leaving the household rather than what the product costs. In its 2024 edition, released December 19, 2025, spending on vehicle insurance went from $1,775 to $1,993 per consumer unit, a 12.3 percent increase that BLS marked as statistically significant.
For scale: total average annual expenditures rose 1.8 percent that year, and that change was not significant. Among the fourteen major categories, housing was the only one whose increase cleared the bar.
Note the unit changed again. CES averages over consumer units - roughly households, about 136 million of them - while NAIC averages over insured vehicles. The two numbers are not comparable and should never be subtracted from one another.
One more figure, from our own comparison of spending against prices for the same two years: insurance spending rose 12.3 percent while the auto insurance rate index rose 17.8 percent. Spending grew more slowly than the index. That is consistent with households changing what they buy - coverage, deductibles, number of vehicles insured - but the two series cannot tell us which, and the arithmetic alone is not evidence of any of them.
What actually moves car insurance rates
NAIC states the mechanism in one line: car insurance rates are developed based primarily on the insurer's cost of paying claims.
That reframes the question. On NAIC's account, what affects car insurance rates starts with the cost of settling claims in a place - an input no single policyholder sets.
The report lists the factors behind state-to-state differences directly. Underwriting and loss adjustment expense. The types of coverages purchased, and the relative amounts. Use of telematics. Weather. Driving locations, accident rates, traffic density, vehicle theft rates. Auto repair costs. Population density. Medical and legal costs. Per capita disposable income. Rate and form filing laws, liability insurance requirements, and auto laws such as seat belt rules and speed limits.
Look at what the price data does to two items on that list. Repair is up 55.5 percent against 2019 and still climbing at 6.6 percent a year - faster than insurance itself is moving now. Parts are up 28.9 percent.
Repairs are paid out of claims, and claims are the input NAIC names first. So at least part of what moved is an input cost rather than anything drivers changed. How much of the increase each side accounts for, the published series do not say - and neither will we.
NAIC also names three measurable variables that correlate with state premium levels - urban population share, miles driven per highway mile, and disposable income per capita - and notes that high-premium states tend to be more urban, with higher wage and price levels and denser traffic.
Why your rate is not your state's average
NAIC prints a warning above its own table. The aggregates behind every figure, the report explains, draw no distinction between policyholder classifications, vehicle characteristics, or the limits and deductibles a customer chose. Then it puts the consequence bluntly:
"direct comparisons between state results should be treated with a high degree of caution"
- NAIC, 2022/2023 Auto Insurance Database Report, p. 5
The people who publish the state table are telling you not to lean on it too hard. Comparing car insurance costs between states is precisely the use they caution against, and average car insurance rates by state describe states rather than drivers.
Insurance rates are built from what claims cost in a place, not from a national mean. Everything that separates your policy from your neighbor's is averaged away in that column: coverage limits, deductibles, what you drive, where in the state you park it, how far you commute. Differences in state auto and tort law, in rate filing rules, in local conditions are not adjusted for either.
So the table is useful for one job and misleading for another. It shows you the scale of the differences between states, and roughly where yours sits. It does not tell you what any driver pays, or what you would pay after moving.
What is worth checking on your own policy
None of the following is a saving. Each is a question with an answer specific to you, and each maps to something NAIC actually lists as a factor in car insurance rates. Car insurance companies weigh these differently from one another, which is the only reason checking is worth the time.
Mileage and telematics
NAIC names use of telematics as a factor, and miles driven as one of three variables correlated with state premium levels. If your commute changed since the policy was written - a new job, remote work, a car that now mostly sits - the mileage on file may describe a life you no longer live. Ask what mileage band you are rated in and what a telematics program would and would not collect.
Deductible and coverage amounts
The types and relative amounts of coverage purchased sit near the top of NAIC's list, which is another way of saying this is the lever with the most travel in it. A full coverage car insurance policy costs more than a liability-only one, and that gap is a choice rather than a rate handed to you.
It is also the lever with a real cost. A deductible is the share of a claim you carry yourself, so raising it moves money from the monthly premium to the moment of a claim. That is a trade, not a discount. If you could not cover the higher deductible tomorrow, the lower premium is buying you a problem. Any change also has to stay inside your state's own liability insurance requirements, which NAIC lists among the things that differ from state to state - check what yours are before changing anything.
Bundling, discounts, and the questions to ask
Bundling auto and home insurance is worth asking about, and the honest framing is that it may or may not beat two separate policies once the coverage is lined up item by item. Compare the same limits, not the headline.
Then ask the plain question: which discounts am I receiving now, and which ones exist that I am not. Insurance companies file their own rates and discounts with the state, so the list only comes from yours. What you should not do is accept a lower price that quietly reduces coverage you would need.
When the premium is what breaks the month
Car insurance is a hard cost to cut, and that is exactly what makes it dangerous to a tight budget. You cannot cancel it like a subscription: states set their own liability insurance requirements, and NAIC lists those requirements among the factors that differ from one state to the next. In many households the car is also how the income arrives.
That places it next to rent and utilities rather than next to discretionary spending - which is where our reading of the underlying Federal Reserve, BLS, and BEA research put the pressure in the first place.
If a renewal has pushed the month out of balance, the first thing worth knowing is how much of your income is already committed. Our free DTI & Max Loan Calculator calculates your debt-to-income ratio from the figures you enter. Read it for what it is: DTI weighs debt payments against income, so it is not a full budget test. It does not see groceries, fuel, childcare, or the reserve you would need if the car broke next month.
Bromoney is not a lender. We do not make credit decisions, fund loans or set loan terms, and no lender is obliged to make you an offer. Nothing here is a recommendation to borrow against an insurance bill - a premium is a recurring cost, and a loan does not make a recurring cost smaller.
If the payment is genuinely unaffordable, the cheaper conversations happen before that: your insurer about payment timing and coverage, and your state insurance regulator, who supervises the market you buy in.
Methodology, sources, and what these numbers cannot tell you
Three separate sources, three different units, and mixing them is the most common error on this subject.
State averages - NAIC 2022/2023 Auto Insurance Database Report, Table 4, adopted December 2025, data year 2023. Unit: average expenditure per insured vehicle. Coverages included: liability, collision, comprehensive.
Household spending - BLS Consumer Expenditures - 2024, USDL-25-1586, released December 19, 2025. Unit: dollars per consumer unit per year. Significance is a t-test on dollar differences at 95 percent confidence; unmarked changes are not distinguishable from zero.
Car insurance rates - BLS CPI-U, series CUUR0000SETE and related, not seasonally adjusted, retrieved from the BLS public data API on August 26, 2026. Unit: index, not dollars. Comparisons against 2019 use the 2019 annual average against the July 2026 month.
Four limits worth stating plainly:
- The state data is three years old. It is the most recent NAIC has published, and 2023 is not 2026. The direction of prices reversed inside that gap.
- The units do not convert. Per insured vehicle, per consumer unit and index points are three different things.
- The CPI series has a hole. October and November 2025 are missing from the published record; the twelve-month comparisons here run July to July and do not cross it.
- None of this is a rate quote. Every figure is an average or an index. What you would be charged depends on facts about you that none of these sources record.
Rates, terms and requirements vary by state and by insurer. This page is general information, not insurance or financial advice.

Denis Goncharenko
Head of Content
Editorial Policy: no secondary statistics. Every claim is linked to an official source and dated — datasets and methods are open for review.

Was this article helpful?
Same blogs
What Average Household Expenses Show About Price Pressure - and What They Can't
The average US consumer unit spent $78,535 in 2024 - about $6,545 a month. This page sets that spending record against the price indexes for the same two years, category by category, using our own CE-CPI crosswalk, and states plainly what the figures cannot show.
Stop Blaming the Latte: Impulse Buying Isn't the Whole Budget Story
BLS data shows apparel and entertainment spending barely moved in 2024, while car insurance, housing and groceries rose - some by double digits. Why the numbers behind the top impulse-buying articles don't hold up, and a review method that starts with the bills, not the coffee.
Cost of Living by State: Prices, Rent and Wages
A 51-row table built from U.S. federal series (BEA, Census, HUD, EIA, DOL), not the private volunteer survey most rankings use. Housing costs vary six times more than goods across states, cheap states aren't always affordable, and minimum wage sits below a modelled living wage everywhere checked.