


Cost of Living by State: Prices, Rent and Wages

Cost of Living by State: Prices, Rent and Wages
Almost every page ranking for cost of living by state prints one number per state and calls it an index. We checked the ten results Google returned on August 27, 2026; of the eight that are articles rather than a repost or an archive, not one used the federal series built for this comparison. Most trace back to the same private survey, in which cities take part on a volunteer basis.
So here is the other table. Every column in it is a United States federal series in the public domain, each with its own publisher, its own reference period and a link to the source.
Cost of living by state: the full table
50 states and the District of Columbia. Price-level indexes use US = 100. The columns carry different reference periods; see the notes below the table.
| State | Price level, all items | Price level, housing | Price level, goods | Median gross rent | Fair market rent, 2BR | Renters paying 30%+ of income | Electricity, cents/kWh | Electricity, year over year | Minimum wage |
|---|---|---|---|---|---|---|---|---|---|
| Alabama | 88.8 | 61.8 | 96.4 | $1,077 | $1,079 | 48.2% | 16.40 | +2.1% | $7.25 |
| Alaska | 102.4 | 93.8 | 106.3 | $1,444 | $1,569 | 41.5% | 28.21 | +5.0% | $14.00 |
| Arizona | 100.7 | 106.8 | 95.4 | $1,672 | $1,706 | 52.4% | 15.18 | -0.3% | $15.15 |
| Arkansas | 86.9 | 58.2 | 93.6 | $982 | $1,064 | 45.5% | 14.12 | +5.6% | $11.00 |
| California | 110.7 | 154.3 | 106.1 | $2,104 | $2,595 | 55.8% | 34.74 | +3.4% | $16.90 |
| Colorado | 103.1 | 127.4 | 98.7 | $1,822 | $1,866 | 52.5% | 17.13 | +6.8% | $15.16 |
| Connecticut | 103.6 | 117.0 | 97.3 | $1,550 | $2,027 | 54.1% | 24.32 | -10.6% | $16.94 |
| Delaware | 99.8 | 102.0 | 96.2 | $1,530 | $1,648 | 50.3% | 19.29 | +6.2% | $15.00 |
| District of Columbia | 109.9 | 155.0 | 106.5 | $1,931 | $2,246 | 47.7% | 24.39 | +7.4% | $18.40 |
| Florida | 103.4 | 122.1 | 98.1 | $1,812 | $1,933 | 62.1% | 15.10 | -1.6% | $14.00 |
| Georgia | 96.3 | 88.7 | 98.9 | $1,506 | $1,550 | 53.1% | 16.36 | +2.5% | $7.25 |
| Hawaii | 110.0 | 125.3 | 111.6 | $1,942 | $2,545 | 55.0% | 52.72 | +28.7% | $16.00 |
| Idaho | 95.5 | 90.0 | 96.3 | $1,384 | $1,404 | 48.4% | 14.37 | +19.1% | $7.25 |
| Illinois | 100.0 | 93.9 | 103.8 | $1,322 | $1,556 | 48.7% | 19.89 | +8.7% | $15.00 |
| Indiana | 93.3 | 73.9 | 95.5 | $1,104 | $1,234 | 48.5% | 17.51 | +6.3% | $7.25 |
| Iowa | 87.8 | 65.3 | 93.7 | $981 | $1,097 | 43.2% | 15.93 | +3.9% | $7.25 |
| Kansas | 90.1 | 71.2 | 94.0 | $1,079 | $1,122 | 43.4% | 15.71 | +4.5% | $7.25 |
| Kentucky | 90.2 | 64.3 | 96.0 | $998 | $1,105 | 45.2% | 14.26 | +6.4% | $7.25 |
| Louisiana | 88.2 | 63.1 | 93.7 | $1,064 | $1,127 | 54.1% | 13.49 | +5.9% | $7.25 |
| Maine | 97.0 | 78.9 | 97.2 | $1,210 | $1,650 | 50.2% | 29.59 | +5.2% | $15.10 |
| Maryland | 105.0 | 121.1 | 102.5 | $1,721 | $1,957 | 51.5% | 21.84 | +13.2% | $15.00 |
| Massachusetts | 105.8 | 128.1 | 98.8 | $1,848 | $2,495 | 52.4% | 29.61 | -2.4% | $15.00 |
| Michigan | 96.2 | 82.3 | 96.0 | $1,168 | $1,310 | 51.2% | 22.99 | +10.4% | $13.73 |
| Minnesota | 98.6 | 91.3 | 100.5 | $1,291 | $1,478 | 47.7% | 17.52 | +2.3% | $11.41 |
| Mississippi | 87.0 | 56.5 | 96.2 | $990 | $1,033 | 50.3% | 14.88 | +5.8% | $7.25 |
| Missouri | 90.8 | 69.9 | 96.3 | $1,067 | $1,138 | 45.2% | 16.22 | +1.9% | $15.00 |
| Montana | 94.6 | 84.6 | 96.0 | $1,177 | $1,522 | 42.7% | 15.14 | +2.2% | $10.85 |
| Nebraska | 90.1 | 75.2 | 94.1 | $1,102 | $1,186 | 46.5% | 13.25 | +0.8% | $15.00 |
| Nevada | 100.0 | 114.1 | 96.3 | $1,709 | $1,719 | 57.6% | 13.11 | +6.9% | $12.00 |
| New Hampshire | 104.2 | 114.9 | 98.6 | $1,558 | $2,038 | 49.4% | 27.01 | +14.9% | $7.25 |
| New Jersey | 108.8 | 134.3 | 107.1 | $1,800 | $2,229 | 52.2% | 24.95 | +0.3% | $15.92 |
| New Mexico | 92.2 | 73.6 | 96.1 | $1,117 | $1,294 | 48.4% | 15.06 | +2.6% | $12.00 |
| New York | 107.9 | 122.2 | 107.3 | $1,634 | $2,374 | 51.5% | 29.49 | +11.1% | $17.00 |
| North Carolina | 94.3 | 81.4 | 96.6 | $1,338 | $1,378 | 51.5% | 14.74 | +10.2% | $7.25 |
| North Dakota | 89.0 | 71.4 | 95.7 | $980 | $1,075 | 36.1% | 14.12 | +3.0% | $7.25 |
| Ohio | 92.8 | 73.0 | 93.7 | $1,090 | $1,219 | 47.7% | 19.19 | +9.7% | $11.00 |
| Oklahoma | 87.8 | 62.8 | 93.8 | $1,044 | $1,122 | 46.1% | 14.33 | +5.1% | $7.25 |
| Oregon | 103.4 | 108.6 | 105.3 | $1,597 | $1,705 | 52.3% | 16.32 | +3.3% | $16.80 |
| Pennsylvania | 97.6 | 85.1 | 99.4 | $1,252 | $1,474 | 49.4% | 21.73 | +10.4% | $7.25 |
| Rhode Island | 102.3 | 105.6 | 97.2 | $1,418 | $1,761 | 51.1% | 29.23 | +8.9% | $16.00 |
| South Carolina | 93.7 | 80.5 | 96.3 | $1,272 | $1,344 | 52.6% | 15.55 | +5.1% | $7.25 |
| South Dakota | 88.6 | 67.6 | 95.5 | $999 | $1,088 | 41.9% | 15.36 | +8.0% | $11.85 |
| Tennessee | 91.9 | 79.1 | 96.2 | $1,284 | $1,335 | 50.2% | 14.07 | +1.8% | $7.25 |
| Texas | 97.1 | 96.5 | 98.1 | $1,475 | $1,520 | 52.7% | 15.94 | +4.5% | $7.25 |
| Utah | 98.9 | 107.8 | 96.4 | $1,593 | $1,566 | 48.2% | 13.37 | +2.1% | $7.25 |
| Vermont | 98.0 | 86.5 | 97.3 | $1,319 | $1,629 | 48.8% | 24.44 | +6.3% | $14.42 |
| Virginia | 101.1 | 106.8 | 100.4 | $1,646 | $1,729 | 49.3% | 17.22 | +13.1% | $12.77 |
| Washington | 107.0 | 126.0 | 104.4 | $1,824 | $2,011 | 50.7% | 14.91 | +15.0% | $17.13 |
| West Virginia | 89.5 | 54.2 | 96.5 | $883 | $995 | 47.0% | 15.45 | -2.3% | $8.75 |
| Wisconsin | 94.1 | 79.3 | 94.3 | $1,142 | $1,250 | 44.9% | 19.56 | +5.6% | $7.25 |
| Wyoming | 92.7 | 71.1 | 95.4 | $998 | $1,067 | 42.9% | 15.24 | +2.4% | $7.25 |
Source: Official U.S. federal data compiled by Bromoney. This is an independent compilation, not an official government publication.
Two habits will save you from misreading it. The columns are not one snapshot: index levels and rent are 2024, fair market rents fiscal 2026, electricity June 2026, the wage floor effective July 2026. And an index of 100 is the country as a whole, so 88.8 means Alabama sat about 11 percent below the national average, not that it is cheap for you specifically.
Two columns are benchmarks rather than observations, and the difference matters. Fair market rent is the level HUD uses to size its voucher payments, not the average rent anyone pays. Minimum wage is a legal floor, not what people actually earn.
Three things the table shows that a cost of living index does not
Goods costs vary narrowly. Housing costs do not
Split the index into its parts and the story changes shape. Goods run from 93.6 in Arkansas to 111.6 in Hawaii, 18.0 index points end to end. Housing runs from 54.2 in West Virginia to 155.0 in the District of Columbia: 100.8 points. As a coefficient of variation, housing costs are roughly six times more dispersed than goods.
Across the 51 rows the all-items index moves closely with its housing component (correlation 0.96) and less closely with goods (0.81). That is association measured on one year of data, not a decomposition of what causes what, and the two components are themselves correlated at 0.72. What it does support is a warning: the housing column spans 100.8 index points while the goods column spans 18.0, so when you read that somewhere is 12 percent cheaper, check which column that gap is sitting in before you plan around it.
Cheap states are not automatically affordable states
An index measures what things cost. It says nothing about what people earn. Put the two side by side and several of the usual cheap states stop looking comfortable.
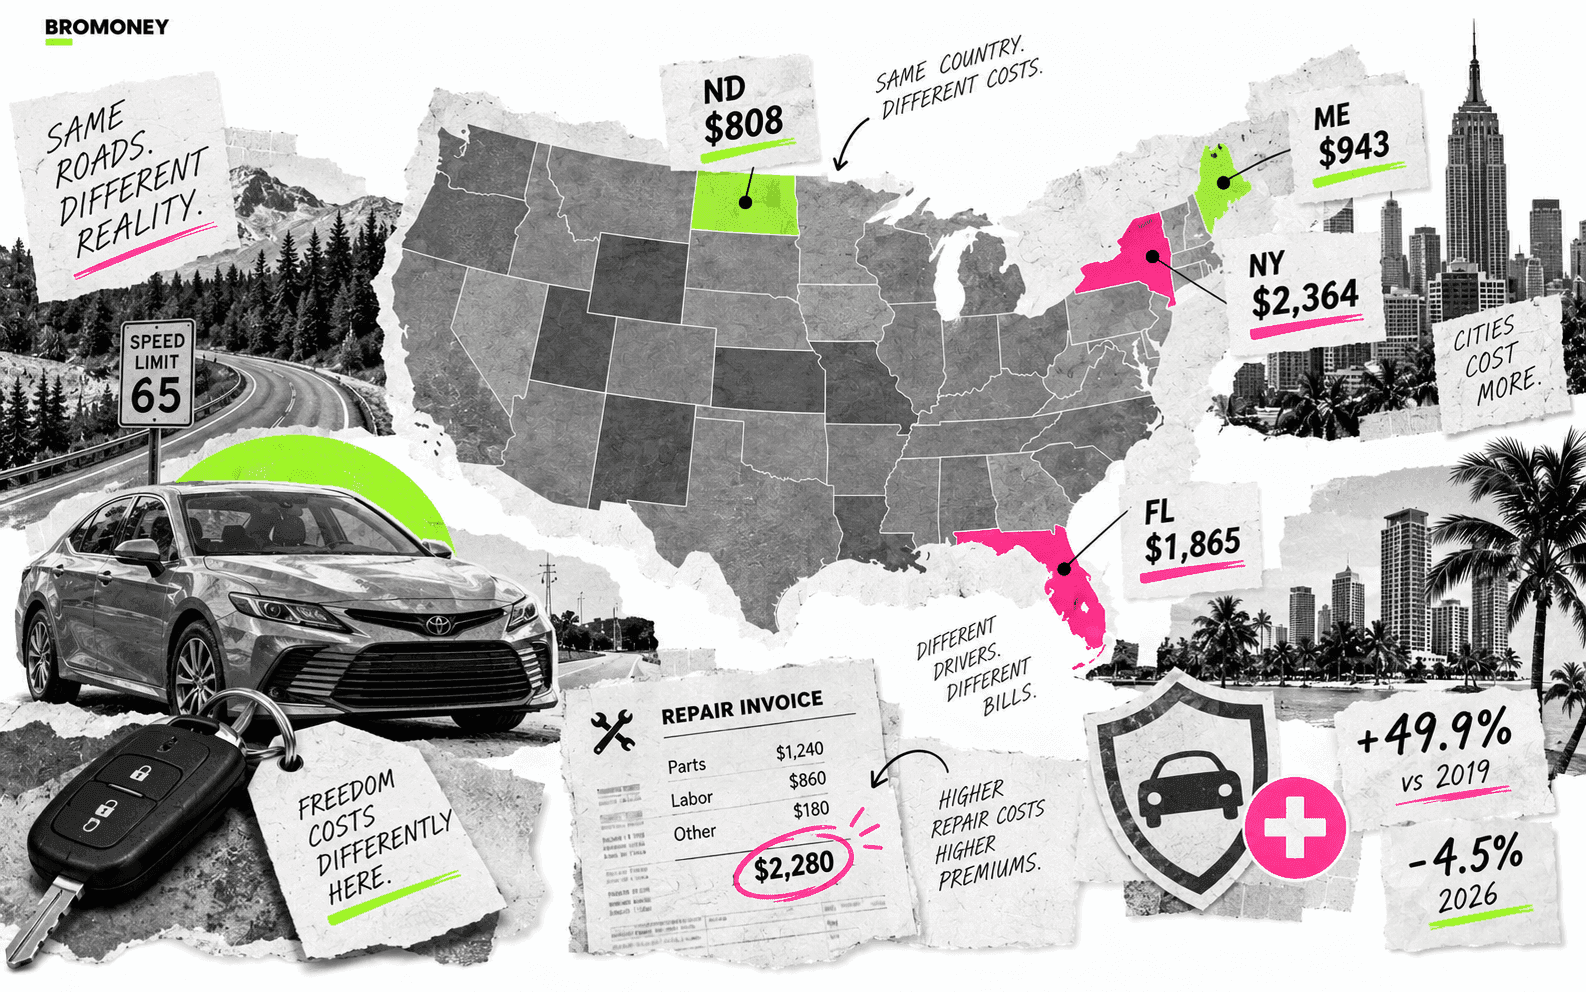
Louisiana sits at 88.2, fifth lowest in the country, yet 54.1 percent of its renter households spend at least 30 percent of income on rent, above the national figure of 51.8 percent. It also carries the second highest average car insurance expenditure in the country, $1,754.03, as reported by the National Association of Insurance Commissioners for 2023. Mississippi, second lowest at 87.0, has 50.3 percent of renters spending the same share of income. Florida runs the other way: 103.4 on the index, the heaviest rent burden anywhere at 62.1 percent, and the most expensive insurance in the same NAIC report at $1,864.63. North Dakota is unremarkable at 89.0 and has the mildest rent burden in the country, 36.1 percent.
That is why the table carries a rent-burden column next to the index. An index level and an affordability measure answer different questions, and reading only the first one is how cheap states get mistaken for affordable states.
Statutory wage floors sit below a modelled living wage
The minimum wage column is a legal floor. Set it against the MIT Living Wage Calculator, which models the income one adult with no children needs, as an hourly rate over 2,080 hours a year, and the floor comes in below the model everywhere we checked.
| State | Minimum wage, July 2026 | Modelled living wage, one adult | Floor as share of model |
|---|---|---|---|
| Missouri | $15.00 | $21.27 | 70.5% |
| Nebraska | $15.00 | $21.75 | 69.0% |
| Georgia | $7.25 | $24.21 | 29.9% |
| Utah | $7.25 | $24.71 | 29.3% |
| New Hampshire | $7.25 | $25.77 | 28.1% |
Living wage data sourced from the Living Wage Institute via https://livingwage.mit.edu, updated February 15, 2026. We show five states because the Institute permits direct use of up to ten locations and asks that its data not be extracted beyond that; a fifty-one-state comparison would need a licence from them, which is why that column is not in the table or the CSV.
What each column measures, and where it comes from
| Column | Source | Period |
|---|---|---|
| Index: all items, housing, goods | BEA, Regional Price Parities by state | 2024, released February 19, 2026 |
| Median gross rent (rent plus utilities) | Census Bureau, ACS 1-year, table B25064 | 2024 |
| Renters paying 30%+ of income | Census Bureau, ACS 1-year, table B25070 | 2024 |
| Fair market rent, two bedroom | HUD, Fair Market Rents | fiscal 2026, effective October 1, 2025 |
| Electricity, cents per kilowatt-hour | EIA, Electric Power Monthly, table 5.6.A | June 2026, with June 2025 alongside |
| Minimum wage | DOL, Consolidated State Minimum Wage Table | effective July 1, 2026 |
Two columns needed a judgment call, and you should know which way we went.
Fair market rent is published per county. We averaged counties within each state weighted by 2023 population, because the alternative understates cities: California's middle county sits at $1,686 while the population-weighted figure is $2,595.
Electricity is one month against the same month a year earlier. That controls for seasons but it is still a month, and it measures a kilowatt-hour rather than anyone's bill. Residential rates were higher year over year in 46 of 51 rows, by a median 5.2 percent: Hawaii 28.7 percent, Idaho 19.1, Washington 15.0, while Connecticut fell 10.6. The distance between 13.11 cents in Nevada and 52.72 in Hawaii is four to one, the widest ratio in the table.
The two insurance figures quoted above are not in the table. They come from the NAIC Auto Insurance Database Report, which is copyrighted and cannot be republished as a column; the NAIC also warns that comparing average expenditures between the states can mislead, because the product is not the same everywhere, and a state looks costlier when drivers there buy higher limits or insure costlier cars.
Why federal parities instead of a cost of living index
The familiar index in search results comes from the Council for Community and Economic Research. That economic research programme surveys a basket of goods in participating cities, and its own page says those cities take part on a volunteer basis. The design suits what it was built for, comparing named cities on comparable items. It is weaker as a claim about a whole state, because the cities that opted in are not a sample of it.
Regional price parities are built for the second job: one method, every state, against a national average of 100, updated annually. They also come apart into components, which is what made that finding visible at all. Their own limit matters too. The housing column covers rented homes only, so ownership enters as imputed rent rather than anyone's mortgage bill.
What the table leaves out: median home price, taxes, childcare
There is no median home price column. That is deliberate: the series underneath measures rents, and buying answers a different question from the one about what leaves your account every month.
There is no tax column either. An index describes what a dollar buys, not what survives withholding, and minimum wage figures are gross. Two states at the same level can leave very different amounts in people's hands after income tax, sales tax and property tax.
Childcare, medical spending and groceries as household budget lines live in a different family of statistics. We treat those separately in our data guide to the household price squeeze.
Most expensive states and cheapest states to live in
By this series the most expensive states to live in are California at 110.7 and Hawaii at 110.0, followed by New Jersey at 108.8, New York at 107.9 and Washington at 107.0. The District of Columbia would sit third at 109.9, between Hawaii and New Jersey, but it is a district rather than a state. The cheapest states to live in are Arkansas at 86.9, Mississippi at 87.0, then Iowa and Oklahoma at 87.8.
That order is close to rankings published elsewhere, two instruments pointing the same way. They part company in the middle of the list and in the components, which is where a decision actually gets made. A state whose cost index scores 94 rather than 97 changes little; a rent column $600 apart, or an insurance and power bill that eats the difference, changes a good deal.
When the gap between costs and pay becomes a cash-flow problem
Three measurements of cost, one direction of travel. The housing index varies far more across the 51 rows than the goods index; statutory floors fall below what the model says one adult needs in the five states shown; and the June residential rate was higher year over year in 46 of 51 rows. For a household with no financial cushion, that arrives as a specific month in which rent, a power bill and a car repair land together.
If that is where you are, the useful next step before any financial decision is arithmetic: what the payment would be, and what share of monthly income it would take. Our guide to loan math walks through principal, interest and term, and the guide to credit score, income and DTI explains what a lender weighs.
In the table above, each state name links to our page for that state wherever we have one.
Download the data
The table is available as a CSV. Every column in it is United States federal data in the public domain, compiled on August 27, 2026; our own contribution is the compilation, the population weighting of fair market rent and the derived year-over-year change, and we place those under CC BY 4.0. Each column keeps its original reference period rather than being adjusted to a common year. We also publish a source manifest naming the exact file, publisher, retrieval date and SHA-256 of every input, so anyone can pull the same files and rebuild the table.

Denis Goncharenko
Head of Content
Editorial Policy: no secondary statistics. Every claim is linked to an official source and dated — datasets and methods are open for review.

Was this article helpful?
Same blogs
What Average Household Expenses Show About Price Pressure - and What They Can't
The average US consumer unit spent $78,535 in 2024 - about $6,545 a month. This page sets that spending record against the price indexes for the same two years, category by category, using our own CE-CPI crosswalk, and states plainly what the figures cannot show.
Why Car Insurance Went Up and What Actually Moves the Premium
Car insurance spending rose 12.3 percent in 2024, one of only two costs BLS called statistically significant. NAIC's 2023 state averages, why rates are falling even as the level sits 49.9 percent above 2019, what actually drives claims costs, and which levers on your policy are worth checking.

Stop Blaming the Latte: Impulse Buying Isn't the Whole Budget Story
BLS data shows apparel and entertainment spending barely moved in 2024, while car insurance, housing and groceries rose - some by double digits. Why the numbers behind the top impulse-buying articles don't hold up, and a review method that starts with the bills, not the coffee.