
Stop Blaming the Latte: Impulse Buying Isn't the Whole Budget Story
Stop Blaming the Latte: Impulse Buying Isn't the Whole Budget Story
Most advice about impulse buying starts by taking a small pleasure away from you. The coffee, the delivery order, the tempting thing you grab at the till. It rarely says what happened to the rest of the budget while you were being careful.
The Bureau of Labor Statistics publishes that part. In 2024, the average US household spent $2,001 on apparel and services across the whole year, and $1,993 on car insurance. One of those two rose sharply. It was not the clothes.
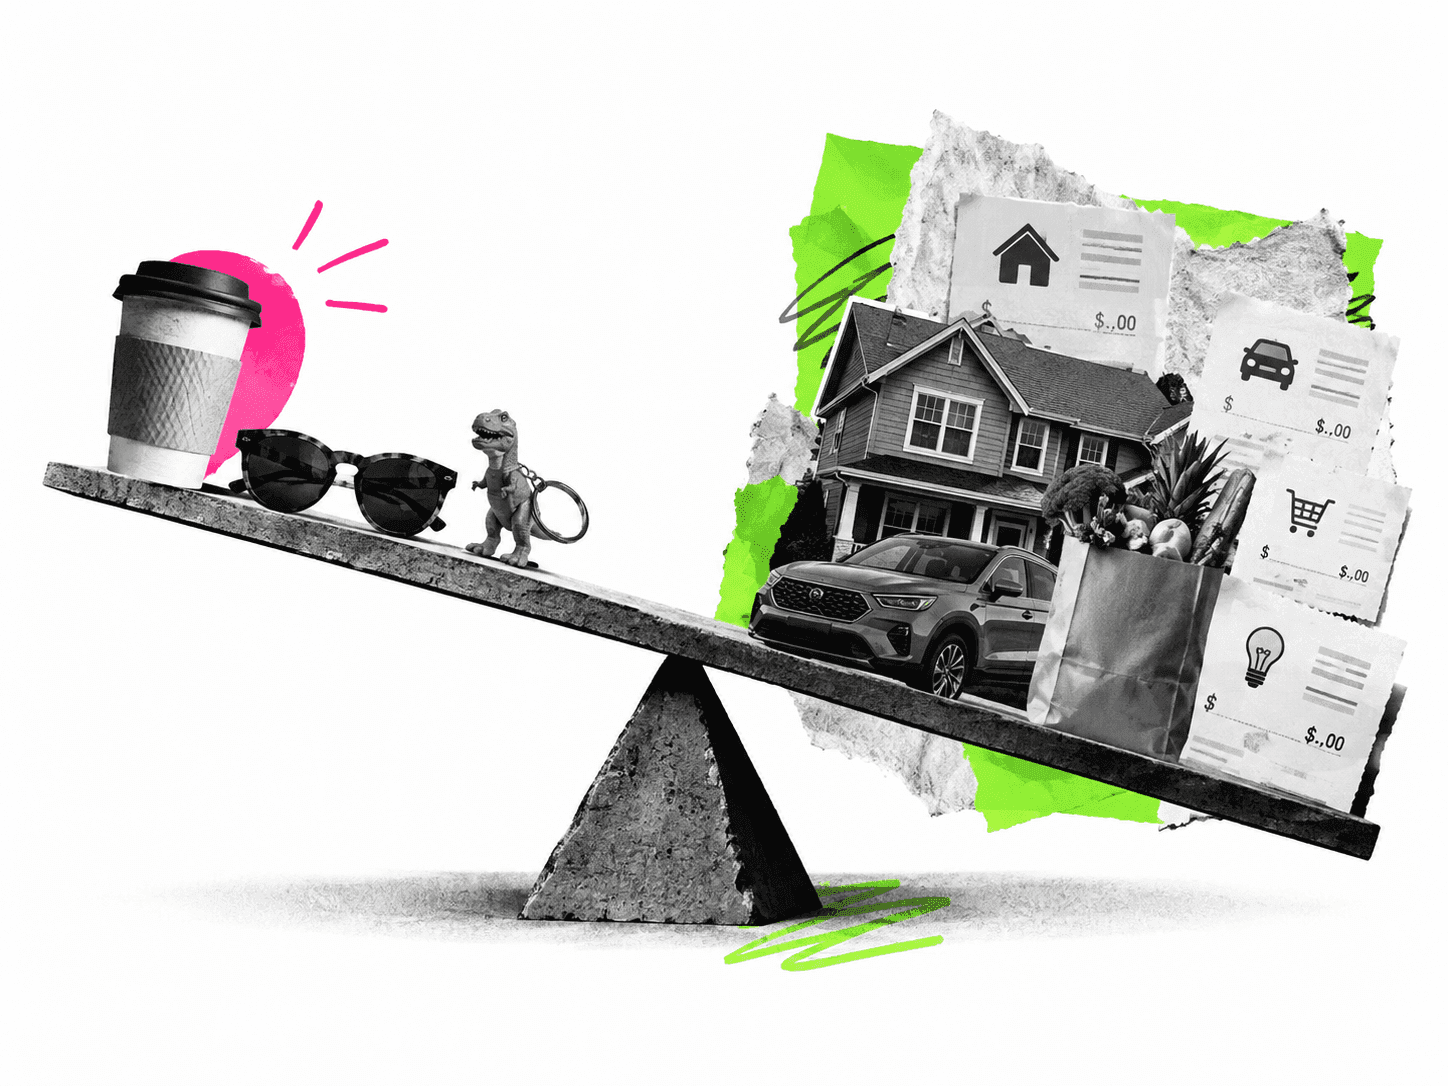
Last year's measured increases landed on housing, cars and the food bill. They did not land on the lines budgeting advice keeps pointing at. That is a reason to open a budget review with the bills rather than with the small stuff – not a verdict on anyone's self-control, which these figures do not record.
This piece does three things: shows which everyday costs actually moved, checks the numbers circulating in the advice pages on this subject, and sets out a review method that does not run on guilt.
What impulse buying is – and what usually gets miscounted as it
An impulse buy is a purchase decided at the point of sale, with no prior intent to buy that item on that trip. Everything written to curb it assumes that definition, and most of it never states it.
That is narrower than how the word gets used. Buying groceries you did not list is unplanned. Buying a jacket you had wanted for a month, on the day its price dropped, is a planned purchase that happened to be triggered. Regret that arrives later does not make it an impulse buy either – buyer's remorse is about the outcome, not the decision.
The distinction matters because the remedies differ. Unplanned purchases respond to structure: a list, a pause, a limit set before you enter the store. Emotional purchases respond to noticing the trigger. Regret usually responds to neither, because the thing was worth buying and the money was tight anyway.
One more category gets folded in wrongly: repeat costs that grew. A subscription you keep, a policy that renewed higher, a basket that costs more for the same items. Those are not impulse purchases at all, and no amount of restraint at checkout touches them.
Which everyday costs actually moved in 2024
BLS tracks household spending through the Consumer Expenditure Survey. The 2024 edition came out on December 19, 2025, and the full category breakdown is in our review of what the latest household spending data shows. Here is the part of table A that matters for this argument.
| Category | 2023 | 2024 | Change | Statistically significant? |
|---|---|---|---|---|
| Meats, poultry, fish, and eggs | $1,164 | $1,414 | +21.5% | Yes |
| Vehicle insurance | $1,775 | $1,993 | +12.3% | Yes |
| Other vehicle expenses | $3,845 | $4,206 | +9.4% | Yes |
| Owned dwellings | $8,699 | $9,310 | +7.0% | Yes |
| Rented dwellings | $5,370 | $5,660 | +5.4% | Yes |
| Dairy products | $602 | $631 | +4.8% | Yes |
| Cereals and bakery products | $830 | $779 | -6.1% | Yes |
| Apparel and services | $2,041 | $2,001 | -2.0% | No |
| Entertainment | $3,635 | $3,609 | -0.7% | No |
| Food away from home | $3,933 | $3,945 | +0.3% | No |
| Drugs | $591 | $658 | +11.3% | No |
| All expenditures | $77,158 | $78,535 | +1.8% | No |
Source: BLS CES 2024, released December 19, 2025, table A. Figures are annual averages per consumer unit - the BLS term for people who share financial decisions.
Read the right-hand column first. Six categories rose by more than the survey's own margin of error: housing on both sides of the rent-or-own line, two lines of car costs, and the protein and dairy aisles.
One caution before drawing anything from that. CES records what households spent, not why. A category can rise because prices rose, because volumes rose, because people traded up, or because the mix of households in the sample shifted. The survey settles where the money went. It does not settle what pushed it there.
Meanwhile the two categories that budgeting advice treats as the problem – clothes and entertainment – did not rise at all. They drifted down slightly, and even that drift sits inside the noise.
Two prices worth holding next to that, with a caveat attached. Over the twelve months to July 2026 the apparel index rose 3.9 percent, the energy index 14.7 percent and gasoline 24.6 percent, according to the July 2026 CPI release. That window is not the one in the table above, and prices are not the same quantity as outlays, so these figures sit beside the spending data rather than explaining it. Apparel is the clearest warning against reading them together: its price index rose while its spending line drifted down.
Why "not statistically significant" is the whole story here
The asterisks in table A are not decoration. BLS marks a change with one when it clears a 95 percent confidence test – the difference is large enough, relative to the survey's own error, to be treated as real rather than as sampling noise.
Apparel at -2.0 percent has no asterisk. Entertainment at -0.7 percent has none. Neither does the +11.3 percent on drugs, and neither does food at home taken as one aggregate at +2.8 percent, which is why this article does not use those two as evidence of anything, and why our own content plan had to be corrected on that point.
So the honest version is narrower than the headline. In the most recent official year, the discretionary lines did not measurably fall, while housing, cars and two grocery groups measurably rose. Why each moved is outside what this survey answers. What follows is only this: a year of restraint on small purchases would not show up in these figures at all.
What the top pages on impulse buying claim, and what the sources say
I pulled the results ranking on this subject in US Google - seven articles and one video - and checked every verifiable number in the seven.
| Page | Number it prints | Where the citation goes | What that source is |
|---|---|---|---|
| htgadvisors.com | "$280 per month on impulse purchases... nearly $3,400 a year" | capitaloneshopping.com/research | Research page of a shopping-rewards service |
| htgadvisors.com | "More than 70% of online shoppers" bought on a price cut or promo | same page | Same source; survey method not shown |
| htgadvisors.com | "Global e-commerce sales surpassed $6 trillion in 2025" | shopify.com/blog | Blog of an e-commerce platform |
| globalcu.org | Waiting period on purchases over $100 | no citation | Editorial recommendation |
| ramseysolutions.com | none | - | Advice without data |
| chase.com | none | - | Advice without data |
| unfcu.org | none | - | Advice without data |
| theguardian.com | "70% unused to this day" | author's own shelf | First-person account |
| stephanjoppich.com | "$60" for gymnastic rings, a "$20" free-shipping threshold | author's own purchases | First-person account |
Three findings. Three of the seven print no figure at all, and a fourth gives a rule of thumb with nothing behind it. Two count their own shelves, which is honest but is not a sample. And every population-level estimate in the set comes from a single page, whose three citations all point at the retail side rather than at a statistical agency.
There is a deeper problem with any "$X a month on impulse purchases" claim, including the ones that sound official. BLS does not measure impulsiveness. The survey records what was spent by category, not whether the shopper planned it that morning. No official series supports a national impulse-shopping total, so anyone printing one is estimating from a panel or a poll.
Fixed and variable expenses: which side is actually squeezing you
A fixed expense is one whose amount is set outside the moment: rent or mortgage, the car policy, the phone plan, insurance premiums, loan payments. You can change it, but only by changing the arrangement - moving, switching insurers, refinancing.
A variable expense is one whose amount you influence each time: food, fuel, eating out, clothes, entertainment. Marketing lives here, and so does most guilt.
Now put the 2024 movements on that map. Housing and both vehicle lines sit on the fixed side outright. Protein and dairy sit on the variable side, but in the part people swap rather than skip. Car insurance alone took $218 more than the year before - larger than the whole $40 apparel decline, and unlike that decline, larger than the survey's own margin of error.
Nobody buys car insurance on impulse. It renews.
Where unplanned spending is most likely to hide - and why the data can't say
No public series can name the aisle where unplanned purchases happen. The surveys record categories, not intentions, so what follows is reasoning from structure, offered as a working assumption rather than a finding.
Food takes 12.9 percent of household expenditures against 2.5 percent for apparel. More to the point, a basket assembled every week, item by item, carries far more separate decisions than a wardrobe bought a few times a year. If impulse spending accumulates anywhere, that is the likelier place - an argument about the number of decision points, not a measurement of any of them.
The protein line shows how little the public data settles. Meat, poultry, fish and eggs rose 21.5 percent in the expenditure table between 2023 and 2024; the price index for that group rose 1.9 percent over the twelve months to July 2026. Different periods, different quantities: the two cannot be subtracted, and nothing about what changed in the basket follows from setting them side by side.
That is where a shopping list earns its keep. Not as self-denial: as a way to see what the basket is doing.
Needs vs wants is a weak test - cost per use is better
The needs-versus-wants sort works on the extremes and fails everywhere in between. Boots are a need in January and a want in July. A second monitor is a want until your work depends on it.
Cost per use replaces the moral question with arithmetic: divide the price by the number of times you realistically expect to use the thing.
An illustrative sort, using round numbers rather than any offer: a $180 coat worn 90 times comes to $2 a wear. A $40 gadget used twice comes to $20 a use. The coat is the larger purchase and the better one. Price alone would have told you the opposite.
How to run the cost per use check before you buy
Three steps, done in the store or with the cart open.
- Before you make a purchase, write down the price and your honest use count. Not the hopeful one - the count that fits how you spent last month.
- Divide. Compare the result against something you already own and value.
- Set your own threshold once, in advance, and keep it. The number matters less than having one before you are standing in the shop.
Purchases that fail this check tend to fail loudly, and the ones that pass tend to be things you had already been circling for weeks. That is the tell: an item that survives the arithmetic was usually never an impulse to begin with.
A calmer way to review small purchases
The method below is deliberately short, because long rules break first. Spending habits move slowly, and anything that assumes otherwise gets abandoned in the first hard week.
Delay rather than forbid. Move the item to a list with a date on it instead of refusing it. Putting a night between the impulse and the purchase is a practical device rather than a proven mechanism: it moves the decision to a moment when the display, the countdown and the mood are no longer in the room. Nothing in it depends on your capacity to resist at the shelf.
Keep one list, not a budget category per whim. A single running list of wanted items does the work of both a shopping list and a waiting room.
Give spontaneity a fixed sum. An amount you can spend without justifying it removes the negotiation. Every credit union guide in the search results says a version of this. The public data has nothing to say about whether it works - it is here because the rest of the method leans on it.
Avoid shopping at the wrong hour. Hungry, tired, angry or lonely is the standard warning, on the reasoning that those states shorten the horizon on any decision. Treat it as a rule of thumb; I have not found a measured estimate of the effect.
Note the trigger, skip the verdict. Write what happened before the purchase - tired, bored, a countdown timer, a bad afternoon. You are collecting a pattern, not building a case against yourself.
Rules that survive contact with a real week
A waiting rule is a device for turning an urge into a decision you can review, not a virtue in itself. Two days is a common suggestion rather than a validated interval - the length that works is the one you will actually keep.
Timed discounts are built to defeat exactly that - manufactured temptation with a clock attached. Treat the countdown as information about the seller rather than about the item's value: retail promotions often repeat, though nothing says a particular one will come back.
Online shopping removes the last of the friction - no queue, no drive home, saved card details - so the pause has to be added back deliberately. Leaving things in the cart is the cheapest version of it, with one catch - some retailers treat an abandoned cart as a signal and follow up with a lower price. That is not a reward for patience. It is the negotiation continuing without you.
When the problem isn't impulse spending at all
Check this before you commit to any of the above. The Federal Reserve's survey of household economic well-being in 2025 found 62 percent of adults switched to cheaper products and 60 percent used less of something or stopped using it in response to higher prices. Almost every one of those coping actions fell over three years. Exactly one rose: increased borrowing, up a point.
Meanwhile 63 percent could cover a $400 emergency with cash - unchanged for three years - and 59 percent had at least one major unexpected expense in the prior twelve months, most often a vehicle repair.
If you already switched brands, already cut usage, and the gap is still there, the gap is not a self-control problem. It is arithmetic, and it wants a different tool - how a loan payment splits between principal and interest answers a question restraint cannot.
If the pressure is on the fixed side, small purchases aren't the lever
Overspending is easier to prevent at the level of a bill than at the level of a basket. Order of operations, when money is tight:
- Total the fixed side first. Housing, insurance, transport, debt payments. Housing and the two vehicle lines accounted for four of the six increases that cleared the significance test in 2024; protein and dairy were the other two. A debt-to-income calculator covers one slice of the list - required debt payments weighed against gross income - so read it as one input, not as a verdict on the budget.
- Re-shop the two or three largest. Insurance and telecom renew on their own terms and rarely improve unless asked.
- Then look at the variable side - starting with groceries, the largest variable line and the one with the most repeated decision points.
- Keep a small unbudgeted allowance. Plans without slack tend to be abandoned early.
None of this promises that a household can restrain its way out of a structural cost increase. Sometimes the honest answer is that income and fixed costs have moved apart, and the next step is a conversation about the terms of a bill rather than a stricter set of rules.
This article reports published statistics and is not financial advice. Figures are national averages and may not describe your situation; a licensed advisor can review your circumstances.
Questions people ask about impulse buying
How much unplanned spending is normal?
No official series answers this, because BLS records categories rather than intentions. A workable personal answer: an amount that leaves the fixed side covered and does not push a balance you carry interest on - and APR rather than the headline rate is what tells you the real cost of carrying it.
Does cutting up the card help?
It helps with the payment step, which is where friction is cheapest to add. It does nothing about housing, car costs or the food bill, which is where the measured increases were.
Is buying something on sale an impulse purchase?
Only if the item was not already wanted. A discount on an item you had listed is timing; one that creates the desire is marketing doing its job.
Do no-spend challenges work?
They are useful as a measurement exercise - a month of receipts you would not otherwise have. Reports of a rebound afterwards are common in personal finance writing; I have not found a measured estimate of it, so treat the challenge as a way to see your own numbers rather than as a cure.
If I stop impulse purchases entirely, how much will I save?
Less than the framing implies, and the arithmetic runs the other way from the usual version. Apparel and entertainment together came to $5,610 in 2024 - a large sum, and one that plainly covers the $218 rise in car insurance and the $250 rise in the protein aisle several times over, if you are willing to buy no clothes and take no leisure for a year.
The point is not that the sum is too small. It is that the movement was not there. Across those two lines households spent about $66 less than the year before, and neither drop cleared the significance test. Whether anyone exercised more restraint is not something these figures record; what they show is measurable movement on one side of the budget and none on the other.

Denis Goncharenko
Head of Content
Editorial Policy: no secondary statistics. Every claim is linked to an official source and dated — datasets and methods are open for review.

Was this article helpful?
Same blogs
What Average Household Expenses Show About Price Pressure - and What They Can't
The average US consumer unit spent $78,535 in 2024 - about $6,545 a month. This page sets that spending record against the price indexes for the same two years, category by category, using our own CE-CPI crosswalk, and states plainly what the figures cannot show.
Why Car Insurance Went Up and What Actually Moves the Premium
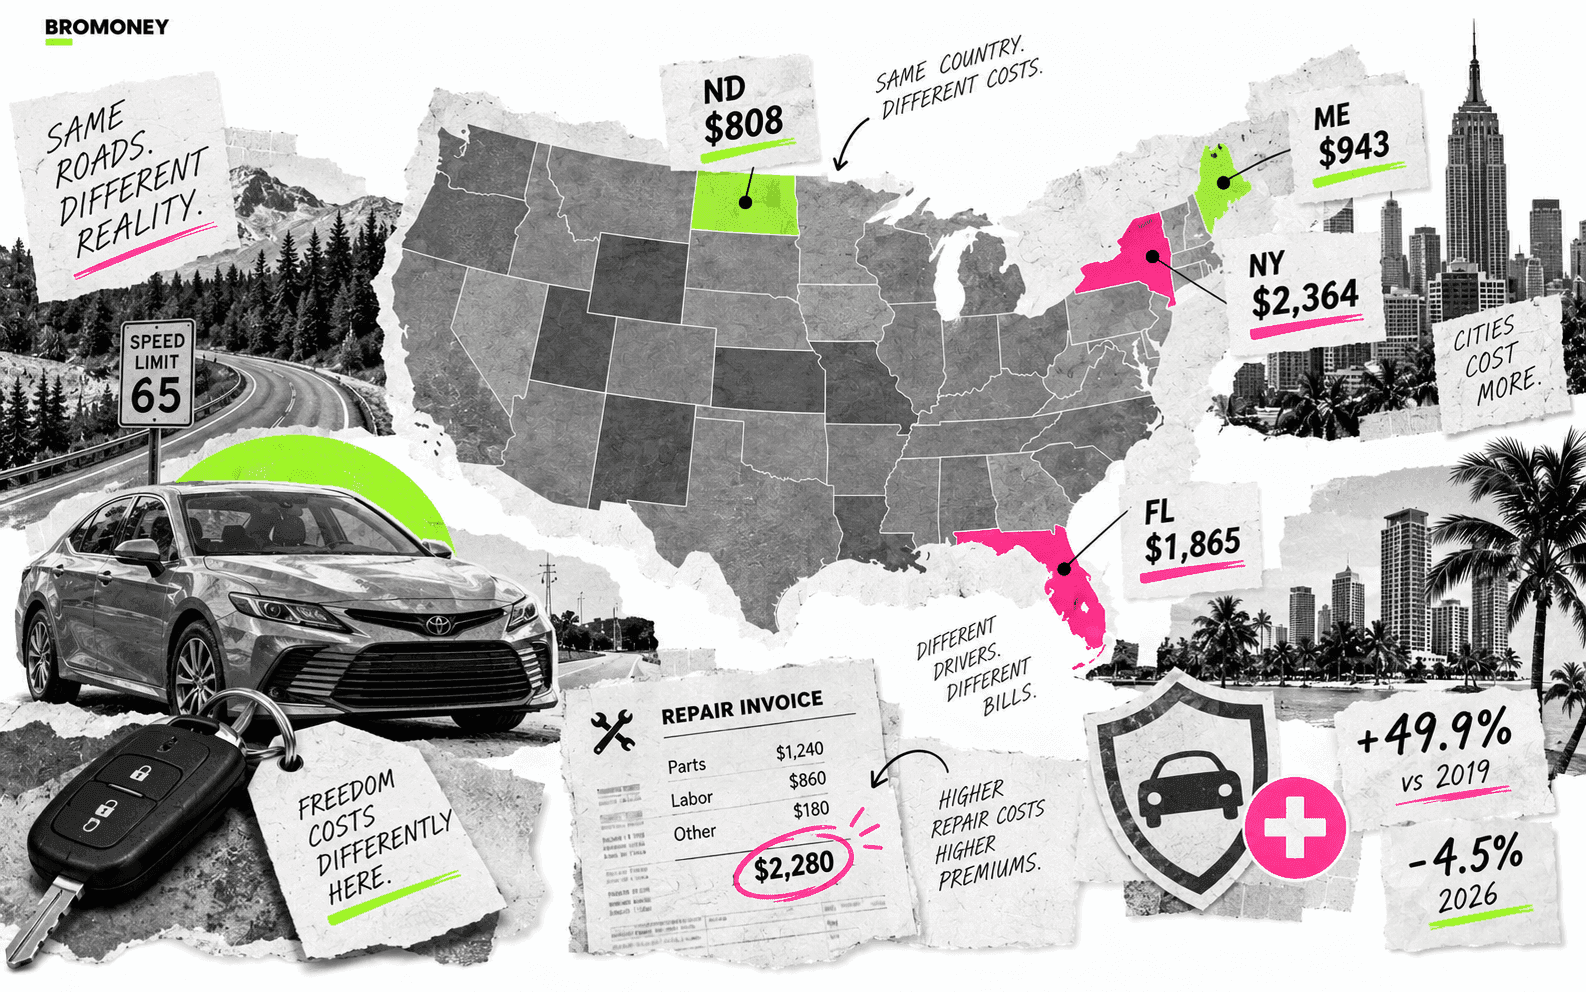
Car insurance spending rose 12.3 percent in 2024, one of only two costs BLS called statistically significant. NAIC's 2023 state averages, why rates are falling even as the level sits 49.9 percent above 2019, what actually drives claims costs, and which levers on your policy are worth checking.
Cost of Living by State: Prices, Rent and Wages
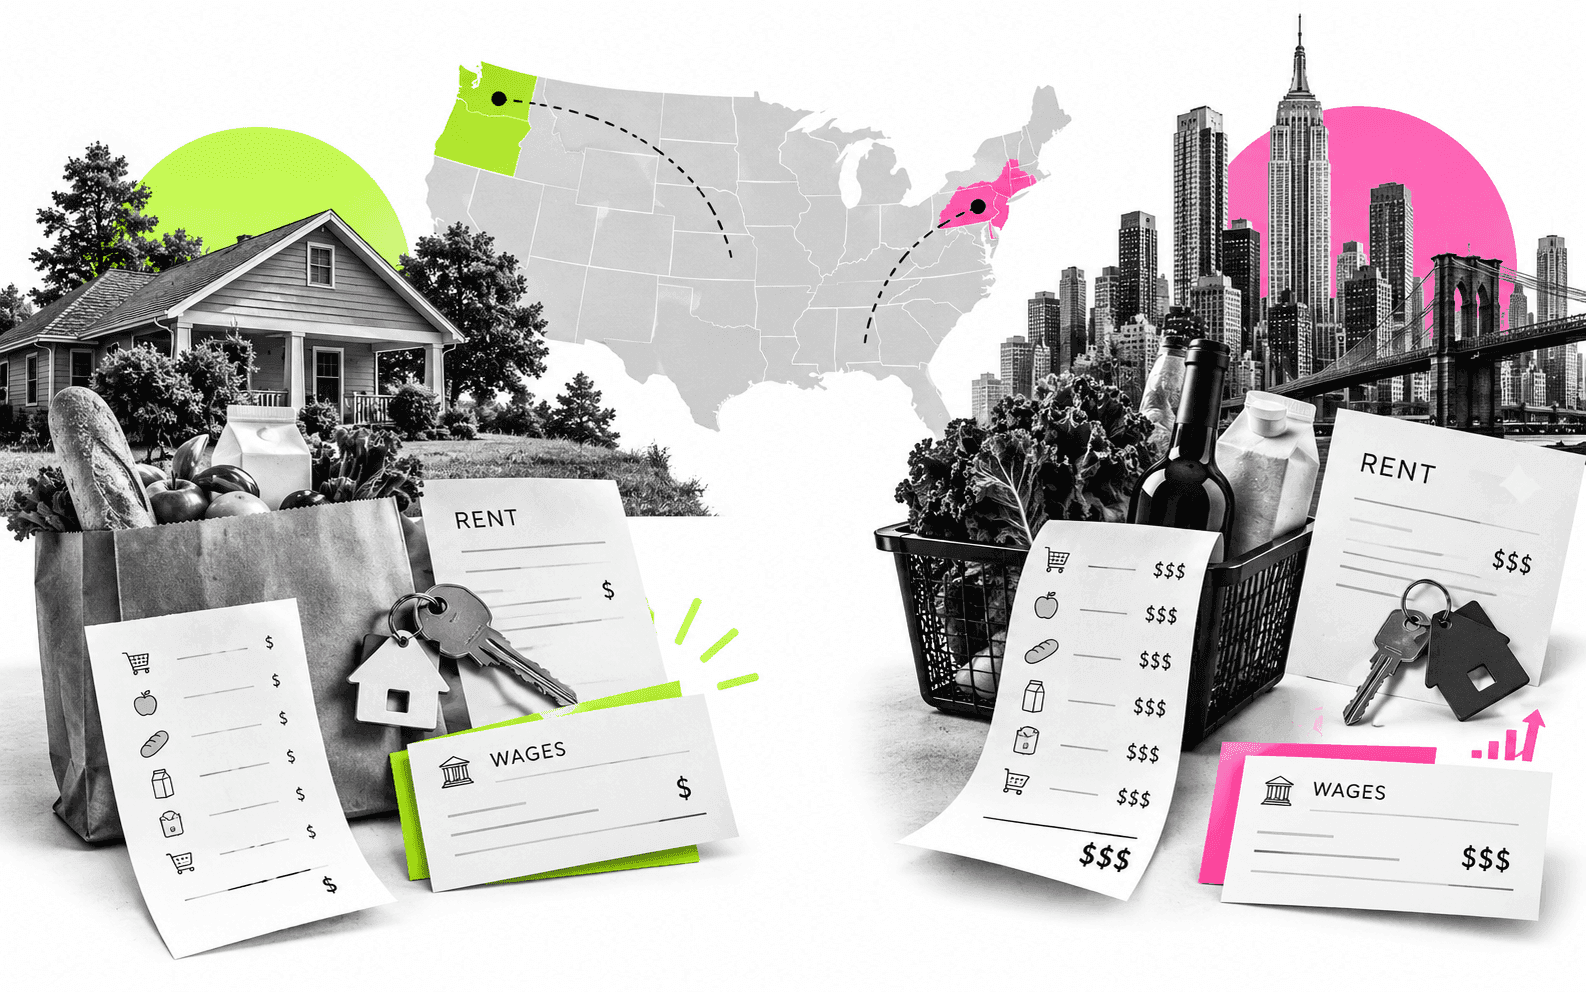
A 51-row table built from U.S. federal series (BEA, Census, HUD, EIA, DOL), not the private volunteer survey most rankings use. Housing costs vary six times more than goods across states, cheap states aren't always affordable, and minimum wage sits below a modelled living wage everywhere checked.