


What a Family of Four Actually Spends on $75,000 a Year

What a Family of Four Actually Spends on $75,000 a Year
$75,000 a year sounds like a comfortable income until you sit down and add up rent, groceries, gas, and everything else four people actually need. If your own numbers feel tighter than that, you are not necessarily doing anything wrong - you may just be missing the real figures to check them against.
This page is a set of published numbers, not a set of opinions. Groceries come from the U.S. Department of Agriculture. Category spending comes from the Bureau of Labor Statistics. Income comes from the Census Bureau. Where we did our own arithmetic on top of those figures, we say so in the same sentence.
Read it with a calculator open. The point is not our totals - it is the monthly budget you run at home.
One thing worth knowing before the numbers start. The federal agencies that publish this data each measure a different thing: USDA prices a specific four-person household cooking at home, while BLS averages households of every size. Those two figures cannot be stacked on top of each other, and most articles that quote both do exactly that.
What does a family of four spend on groceries each month?
$1,018.20 per month, or $235.00 a week, according to the USDA Thrifty Food Plan for May 2026. That is the cheapest of the four USDA food plans, and it assumes every meal and snack is prepared at home. It is the floor, not the average.
Over a year that comes to $12,218.40. That annual figure is our own arithmetic from the USDA monthly number, not something USDA prints.
The other three plans run higher:
| USDA food plan | Monthly, family of four | Annual (our arithmetic) |
|---|---|---|
| Thrifty (published by USDA) | $1,018.20 | $12,218.40 |
| Low-Cost (our calculation) | $1,122.00 | $13,464.00 |
| Moderate-Cost (our calculation) | $1,386.70 | $16,640.40 |
| Liberal (our calculation) | $1,675.30 | $20,103.60 |
All four are May 2026 cost levels, U.S. average.
How we calculated the four-person totals
Only one of those four numbers is printed by USDA as a family total. The other three are ours, and the difference matters if you plan to cite them.
- Data year: May 2026 cost levels, U.S. average, from two USDA reports.
- Household: the USDA reference family - a male and a female aged 20 to 50 plus two children aged 6 to 8 and 9 to 11.
- The $1,018.20 figure is printed as a family total in the Thrifty Food Plan report.
- The $1,122.00, $1,386.70, and $1,675.30 figures are our calculation from the USDA per-person figures, not USDA totals. The three-level report publishes costs one person at a time. We added the four members of the reference family together, which is the procedure the report's own footnote gives - sum each person's cost, then adjust for household size, with no adjustment for four-person households.
- Included: all food and drink prepared at home.
- Not included: restaurants, takeout, school lunches bought at school, and anything else eaten away from home.
If you need a grocery figure with no derived math behind it, use the $1,018.20.
Who is USDA's reference family of four?
A male and a female aged 20 to 50, plus two children aged 6 to 8 and 9 to 11, according to the USDA Thrifty Food Plan report. That specific household is written into the Food and Nutrition Act of 2008, and USDA notes it is the family used to set the maximum SNAP allotment, adjusted down for smaller households and up for larger ones.
Two toddlers cost less to feed than two teenagers. If your kids are older than eleven, the reference figure is low for your budget.
What do the USDA food plans leave out?
Everything eaten away from home. USDA states the plans assume all meals and snacks are prepared at home, so restaurants, drive-throughs, coffee, and workplace lunches sit outside these totals entirely.
That is the single most common reason a real grocery-plus-food bill lands far above the USDA number in a monthly budget. Track the two spending lines separately or the comparison tells you nothing.
Is $75,000 a year above or below what US households make?
Below. Median household income was $83,730 in 2024, the Census Bureau reports in Income in the United States: 2024.
So a $75,000 household is under the national middle - and that is a gross figure, before payroll taxes, insurance premiums, and retirement contributions come out. Every calculation below that involves your own budget should run on the money that actually lands in your account, which we cannot produce estimates for because withholding varies by state and by household.
What does the average US household spend in a year?
$78,535, according to the Bureau of Labor Statistics Consumer Expenditure Survey for 2024. That figure covers all consumer units of every size - singles, couples, and large families averaged together.
Read that caveat twice. BLS does publish breakdowns by household size, but we could not verify which data series corresponds to a four-person unit, so we are not using one. A four-person household with kids spends more money than this average on most lines and less on almost none.
So treat the four category figures below as a shape rather than a target: they tell you which lines dominate an American budget and roughly in what proportion, giving you a reference point rather than a rule. Use them to check whether your own housing or transportation share is unusual. Do not use them to decide how much money your family should spend.
How much of that goes to housing?
$26,266 a year in 2024, per the BLS Consumer Expenditure Survey housing series. That works out to $2,188.83 a month and 33.4% of total spending - both of those are our arithmetic from the BLS annual figure, not BLS-published values.
Housing is the largest single line by a wide margin. It is also the line with the widest regional spread - the same household carries very different living costs in different metro areas - which is why a national average is a starting point and not a target.
How much housing can a $75,000 income carry?
Households are considered cost-burdened when they spend more than 30% of income on rent, mortgage payments, and other housing costs, the Census Bureau reports, citing the Department of Housing and Urban Development's definition. Above 50% of income, the same Census release calls a household severely cost-burdened.
Run against $75,000 gross, 30% is $22,500 a year, or $1,875 per month. That is our arithmetic on the federal threshold, not a federal recommendation for your budget.
Two cautions. The threshold is a housing-policy definition of hardship, not a personal rule for your budget. And running it on gross income flatters the result - on take-home pay the same rent takes a bigger share of the money you actually have.
How much goes to transportation?
$13,318 a year in 2024, per the BLS Consumer Expenditure Survey. That is $1,109.83 a month and 17.0% of total household spending, both our arithmetic from the BLS annual figure.
Transportation is the second-largest category in the survey. It carries car payments, fuel, insurance, and repairs together, which is why cutting this spending usually means buying a different vehicle rather than trimming a habit.
How much goes to health care?
$6,197 a year in 2024, per the BLS Consumer Expenditure Survey - $516.42 a month, 7.9% of total spending, both figures our arithmetic from the BLS annual number.
This one moves more than any other line depending on whose insurance you are on. A household whose employer covers most of the family premium and one buying coverage on its own are not in the same budget conversation.
How much goes to food once restaurants are counted?
$10,169 a year in 2024 for food at home and food away from home combined, per the BLS Consumer Expenditure Survey. That is $847.42 a month and 12.9% of total spending, both our arithmetic.
Set that beside the USDA Thrifty figure of $1,018.20 a month for four people cooking every meal at home. The BLS average is lower because it averages households of every size, most of them smaller than four. The two numbers measure different things and should never be added together.
What do the four biggest categories come to?
Housing, transportation, health care, and food add to $55,950 a year using the 2024 BLS figures. That total is our addition, not a BLS-published subtotal.
Against a $75,000 gross income that is 74.6% - again our arithmetic. On take-home pay the share is higher still, and nothing in that $55,950 covers child care, debt payments, retirement contributions, or savings. That gap is common, not a sign you have done something wrong with the numbers above it - the next two sections show you how to size it and plan around it.
What does child care do to a four-person budget?
It is often the biggest line in a four-person budget, which is exactly why it deserves a real number instead of a guess - and we are not going to put one here. The federal price database we wanted to cite was not reachable at the time of writing, and a child care figure without a verifiable source is worth less than no figure.
What we can say is structural: child care behaves like housing, not like groceries. It is a fixed monthly obligation tied to your ability to work, it does not shrink when you economize, and it usually ends abruptly rather than tapering.
The good news is that this is the one number on this page you can pin down exactly, with a few phone calls. Get your own quotes from two or three centers near you and treat the result as fixed, not variable. Our guide to what child care costs and how to budget for it covers how to slot it in.
What about costs that don't arrive every month?
Car registration, insurance renewals, school fees for the kids, holiday spending, and the annual dentist visit are all real expenses and none of them show up in a normal month. They land in a specific month and can throw an otherwise working budget off - not because anything went wrong, but because they were never on the calendar.
The fix is arithmetic, not discipline: total the yearly amount, divide by twelve, and save money toward it every month. We walk through the sorting in one-time versus recurring expenses.
How much is left after the mandatory costs?
Take your monthly take-home pay. Subtract your monthly expenses: housing, utilities, groceries, transportation, insurance premiums, child care, and the minimum payments you already owe. What remains is your true monthly slack - the only dollar figure that tells you what a new fixed cost would do to you.
Use your own figures, not the averages above. The national numbers tell you what is typical; only your own spending tells you what is affordable.
Do the subtraction on a normal month and then again on your worst month of the past year. The gap between those two answers is what most budgets get wrong - a household that is comfortable eleven months of the year and short in the twelfth does not have a spending problem, it has an irregular-expense problem, and the two are fixed differently.
Write the remainder down somewhere you will see it again. It changes when rent renews, when a car is paid off, and when your kids age out of care, so it is worth revisiting the budget every time one of those happens.
How do you tell whether a monthly payment fits what's left?
Run the payment against that slack figure, dollar for dollar, not against your income. If a proposed monthly payment consumes most of the money that remains after mandatory spending, the budget has no absorption left for a car repair or a medical bill in the same month.
The method for splitting the remaining money into categories and sizing a debt payment against them is in our guide to envelope budgeting and debt payments. That is a calculation, and it should be done before any borrowing decision, not after.
Which budgeting method should you run these numbers through?
Any of them, as long as it starts from take-home pay and points at your financial goals - whether you want to save money, pay down debt, or simply stop guessing. The percentage-split rule and zero-based budgeting both work with the figures on this page; they differ in how much bookkeeping they ask of you each month. The comparison is in our budgeting methods guide.
Method matters less than inputs. A precise system running on guessed grocery and housing numbers produces a precise wrong answer.
Where do you keep the numbers once you have them?
Two options, and both work. Download our family budget template if you want the categories already laid out, or read the software versus spreadsheets comparison if you would rather have a budgeting app pull transactions in automatically.
Pick whichever one you will actually open in month three.
Where your numbers will look different
Four things move these figures more than anything else, and none of them are about spending habits.
Region. The BLS housing average of $26,266 a year is a national figure. Rent for the same three-bedroom unit can differ by a factor of two or three between metro areas, and housing is the largest living cost in the budget.
How old your kids are. The USDA reference family has children aged 6 to 8 and 9 to 11. Younger kids shift spending from groceries to child care; older kids eat considerably more.
Whether you own or rent, and at what rate. A mortgage locked in years ago and a lease renewed this year produce very different housing lines at identical income.
Whether your employer pays for health coverage. The BLS health care average of $6,197 a year blends households with generous employer coverage and households buying their own. Your number will sit at one end or the other, rarely in the middle.
If your totals do not line up with the national ones, that is expected. Averages describe the country, not your household.
How much should you spend on groceries?
Start at $1,018.20 a month if you are cooking every meal at home for four people, using the USDA Thrifty Food Plan for May 2026, and adjust from there. Moving up to the Moderate-Cost level adds $368.50 a month, or $4,422 a year - that gap is our arithmetic from the two USDA plan levels.
Whatever level you pick, keep spending on restaurant meals - and anything else you are buying away from home - on its own line. It is the difference between the USDA figures and what actually leaves your account.
What should you do first?
Write down four numbers this week: your take-home pay, your housing cost, your transportation cost, and last month's actual food total split into grocery spending and eating out. Those four are giving you enough to place yourself against everything above.
Then subtract. The remainder is the number that governs your financial goals for the year, and most households have never written it down.

Denis Goncharenko
Head of Content
Editorial Policy: no secondary statistics. Every claim is linked to an official source and dated — datasets and methods are open for review.

Was this article helpful?
Same blogs

Saving Money on Groceries Is Not a Test of Willpower
Federal data shows six grocery categories moving at different rates, not one bill rising evenly. Why the national CPI, the CES spending survey, and USDA's own forecast are each the wrong number to budget against - and how to build your own monthly figure from 8 to 12 weeks of receipts instead.
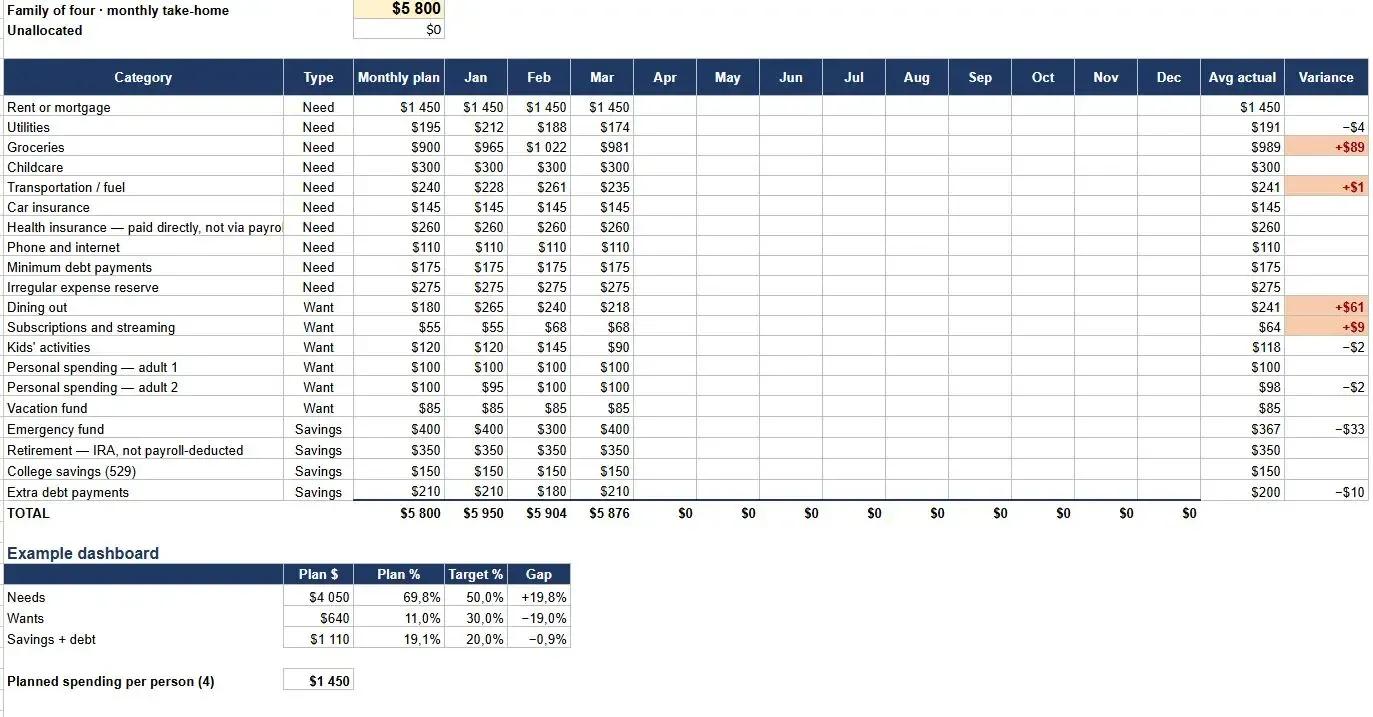
Free Family Budget Template for Excel and Google Sheets
A free household budget spreadsheet for families of three to five, with categories pre-filled and a separate tab that spreads yearly bills like insurance and registration across all twelve months. No email, no sign-up, works in Excel and Google Sheets.

Why Parent PLUS Loans Have Become a Hidden Retirement Crisis for American Parents
Parent PLUS loans can follow parents into retirement, reduce savings, and expose Social Security benefits to offset after default. Here is what near-retirement borrowers should know.